One question that has come up recently is about Business trialists: how long do they stick with the trial before becoming inactive and churning from Buffer?
To answer this question, we can analyze the data in this Look. The dataset contains the trial start and end dates for each user, as well as the days in which there were any actions_taken events triggered.
The number of actions for each day is counted for up to 30 days after the trial start date for each user. In our analysis, we can count how many users have a maximum action date 1, 2, 7, etc. days after their trial began to estimate the percentage of trialists that become inactive on each day of the trial.
Data collection
We can use the get_look() function from the buffer package to collect data from the Look mentioned above.
# Get data from look
trials <- get_look(3975)
Let’s tidy up the data quick.
# Rename columns
colnames(trials) <- c('start_date', 'end_date', 'user_id', 'activity_date', 'trial_day', 'actions')

# Set dates as date objects
trials$start_date <- as.Date(trials$start_date, format = '%Y-%m-%d')
trials$end_date <- as.Date(trials$end_date, format = '%Y-%m-%d')
trials$activity_date <- as.Date(trials$activity_date, format = '%Y-%m-%d')

# Calculate trial length
trials <- trials %>%
  mutate(trial_length = as.numeric(end_date - start_date),
         trial_day = trial_day - 1)

# Filter out trials that started in the last month
trials <- trials %>%
  filter(start_date < as.Date('2017-06-24'))
Now that the data is clean, we want to calculate the latest date, after the trial began, that the user was active.
# Group by user
by_user <- trials %>%
  group_by(user_id, start_date, end_date, trial_length) %>%
  summarise(last_active = max(activity_date),
            last_trial_day_activity = max(trial_day))
Cool. Now we’re ready to explore a bit.
Exploratory analysis
Let’s see how many users were last active on each day. To begin, let’s filter our data so that only 14-day trials are included.
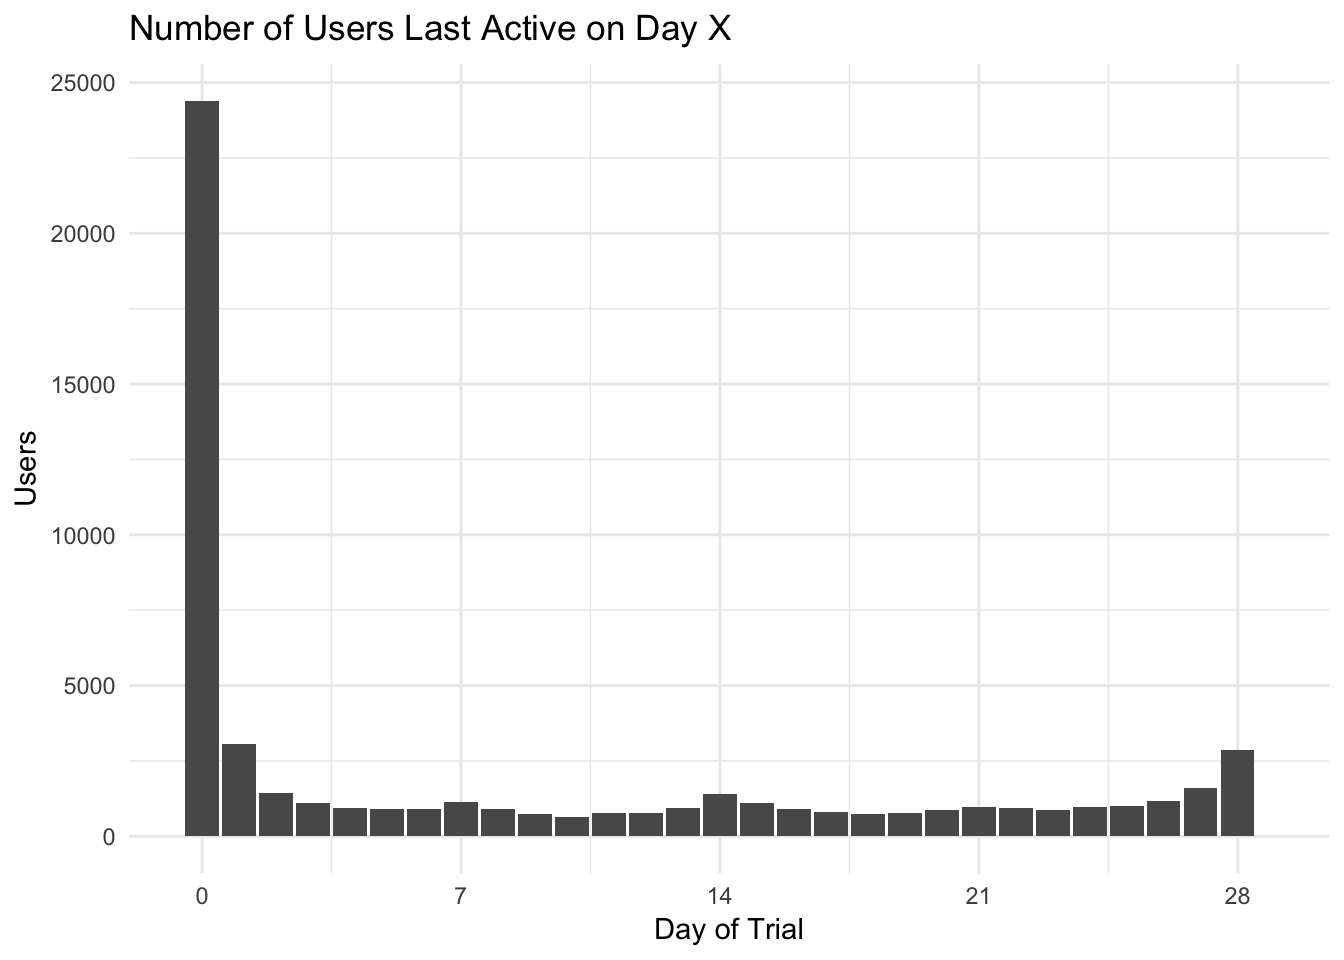
As we can see, the biggest dropoff by far comes after the first day. We’ve seen in the past that many users start trials shortly after signing up for Buffer, so this might be something that we’d expect to see. Let’s see if we can calculate the percentage of users that are still active after each day of the trial.
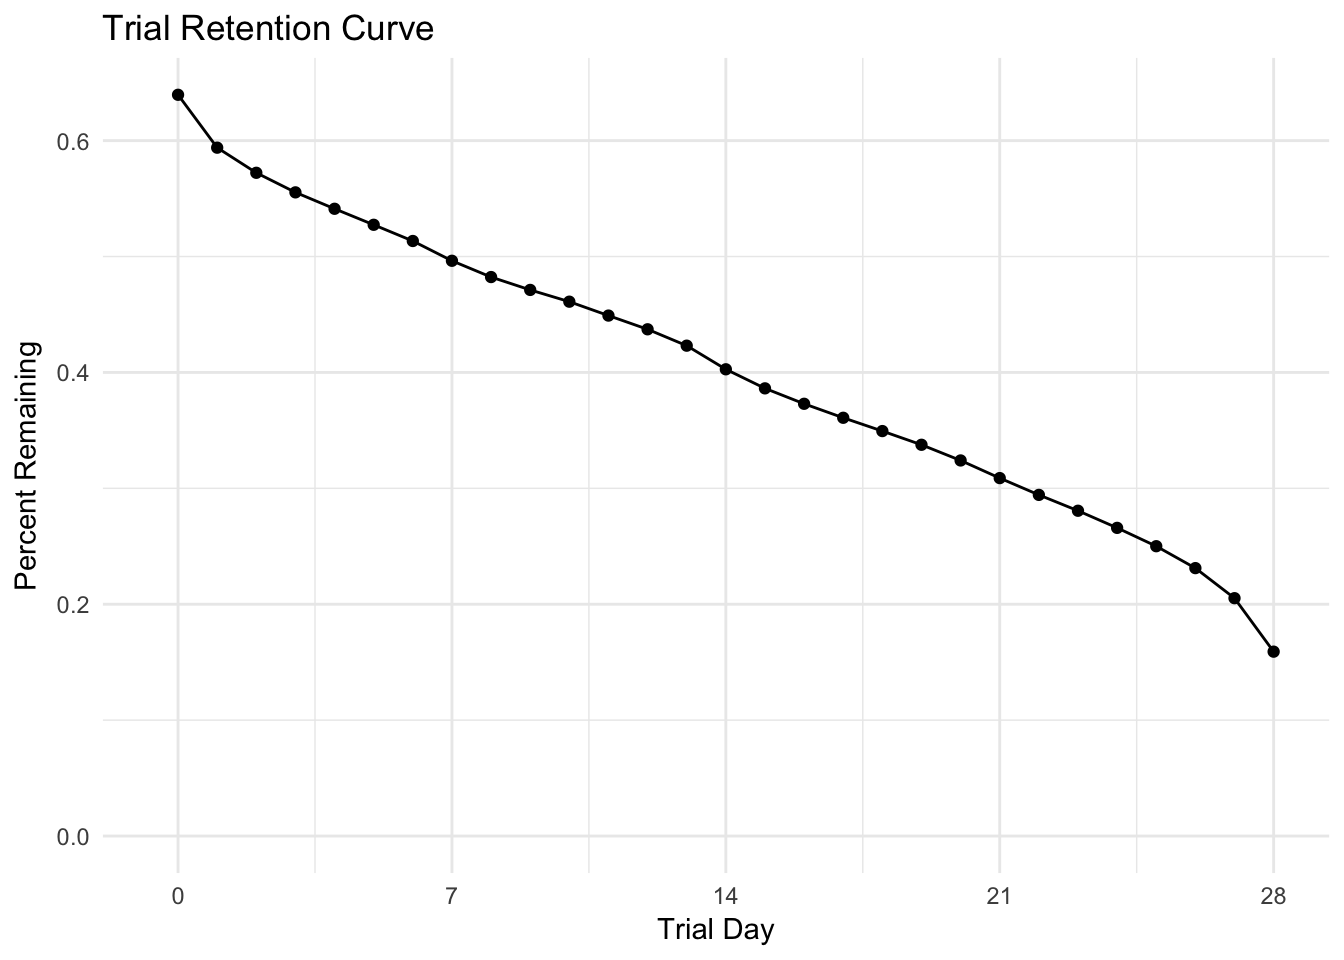
This plot shows the percentage of trialists that are still active after each trial day. We can see that the biggest drop comes from the first day – only 63% of Business trialists from the past year were active after day 0.
After the first day, there percentage of users remaining decreases linearly, with around the same percentage dropping out each day.
In the future, we can segment these retention curves by user attributes, like the type of trial, trial length, or weekday that the trial started. For now, we’ll leave it here. :)