Involuntary churn is a subset of churn in which the cancellation event was not directly initiated by the customer. For us, this occurs when there have been four consecutive failed payments.
The reasons for the failed payments are varied, but we can assume that there are customers whose intention was to continue subscribing to the service. In most cases, they could not because their credit card either expired or was declined for one reason or another.
In this analysis we’ll start small. We’ll try to answer three simple questions about involuntary churn to gain a better understanding of where we stand:
- What is the ratio (%) of involuntary churn to total churn ?
- How much revenue is lost to involuntary churn?
- We send 3 reminder emails after a failed payment - how many people open them? How many open them on a mobile device?
Data collection
To answer the first question, we can query the revenue_events table, which records MRR-related events like churn, upgrades, downgrades, and the like. We can join in the stripe._charges table to check whether the charges associated with the last invoice were paid or failed.
with last_invoice as (
    select
    i.subscription_id
    , i.id as invoice_id
    from stripe._invoices as i
    inner join (select subscription_id, max(date) as latest_date from stripe._invoices group by 1) recent
    on i.subscription_id = recent.subscription_id
    where
    i.date = recent.latest_date
    ),
    last_charge as (
        select
            c.invoice as invoice_id
            , c.id as charge_id
            , c.captured
        from stripe._charges as c
        inner join (select invoice, max(created) as latest_charge from stripe._charges group by 1) recent_charges
            on c.invoice = recent_charges.invoice
        where c.created = recent_charges.latest_charge
    ),
    last_invoice_and_charge as(
        select
            last_invoice.subscription_id
            , last_invoice.invoice_id
            , last_charge.charge_id
            , last_charge.captured
        from last_invoice
        left join last_charge
            on last_invoice.invoice_id = last_charge.invoice_id
    )
    select
    e.created_at
    , e.customer_id
    , e.id
    , e.subscription_id
    , e.plan_id
    , e.plan_interval
    , e.mrr_type
    , e.subscription_mrr_value
    , e.type
        , c.invoice_id
        , c.charge_id
        , c.captured
    from revenue_events as e
    left join last_invoice_and_charge as c
        on e.subscription_id = c.subscription_id
    where e.mrr_type = 'churn'
    and e.created_at > (current_date - 730)
Great, we now have around 80 thousand churn events from the past two years in a dataframe. The dataset includes the last invoice ID for that subscription, the last charge ID for that invoice, as well as whether or not the last charge for that invoice was captured. If the last charge for that subscription was not captured, we can assume that it failed, and that this churn event is an involuntary one.
Data tidying
In order to answer the first question regarding the ratio of involuntary churn to total churn, we’ll want to group the churn events by a certain time-frame. In this analysis I’ll choose to group by month, but we could also do so by week. Let’s extrace the month from the created_at column.
# Extract month
events <- events %>%
  mutate(month = as.Date(paste0(format(created_at, "%Y-%m"), "-01")))
There are values with NAs in this dataset. If we take a closer look at these subscriptions and invoices, we’ll notice that the subscriptions do not have any charges associated with them in the stripe._charges table! That seems odd - something to look into in the future.
For now, let’s group the churn data by month and calculate some summary statistics. We’ll calculate the number of churn events, the number of customers lost, and the MRR amount lost to churn.
# Group churn events by month
by_month <- events %>%
  group_by(month, plan_interval, captured) %>%
  summarise(events = n_distinct(id),
            customers = n_distinct(customer_id),
            mrr = sum(subscription_mrr_value)) %>%
  mutate(percent_of_events = events / sum(events),
         percent_of_mrr = mrr / sum(mrr)) %>%
  filter(month != '2015-07-01' & month != '2017-07-01')
We’re now ready for some exploratory analysis.
Exploratory analysis
What percentage of all churn events is made up of involuntary churn?
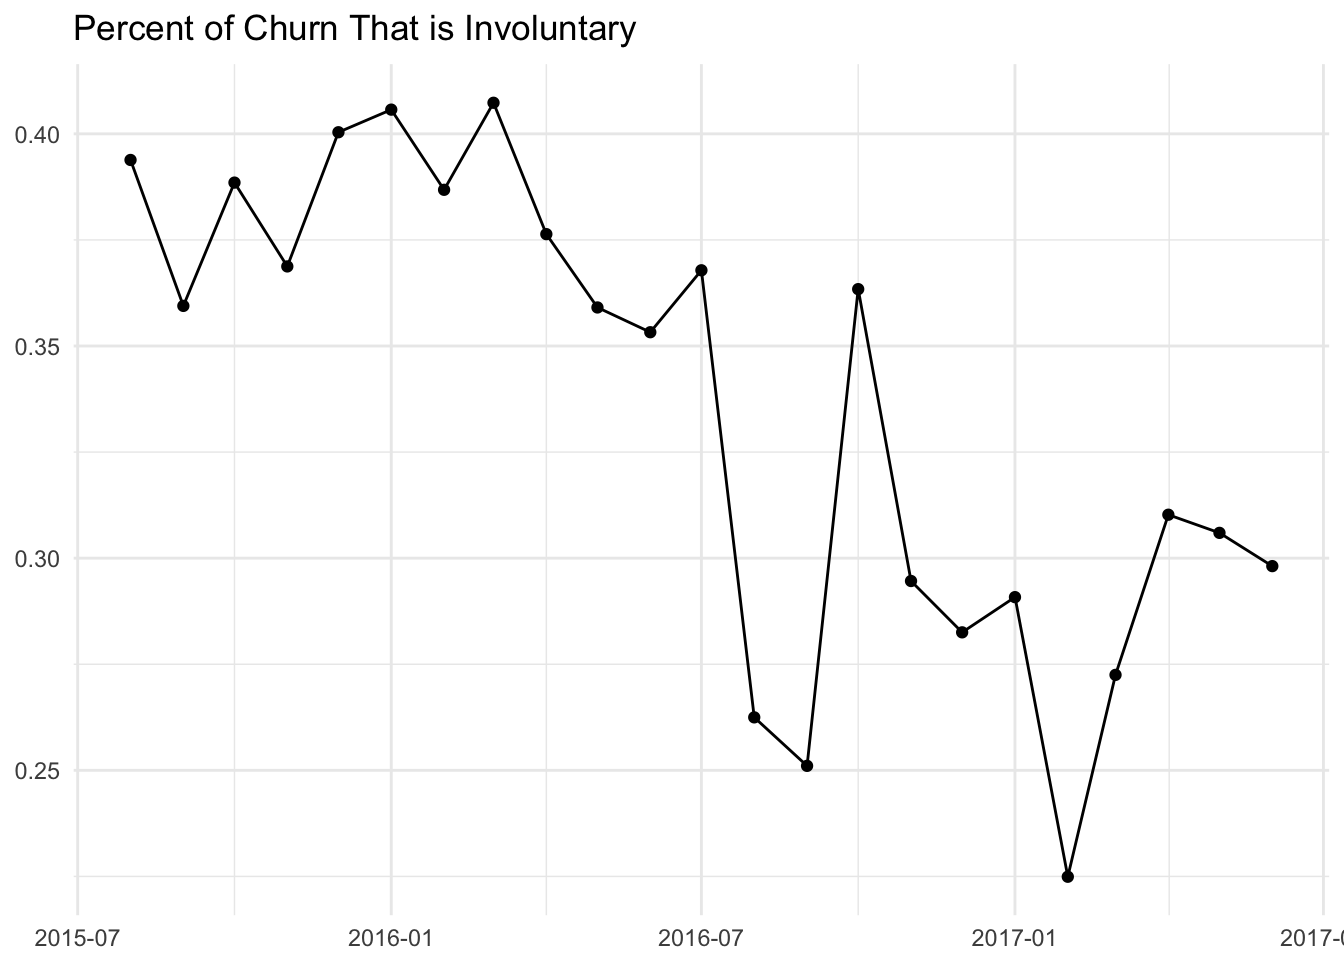
Overall it looks like there is a clear, decreasing trend. Torwards the end of 2015, around 40% of churn events ended with a failed charge! That has decreased to around 30% now, which is still a high percentage. Let’s take a closer look at June 2017.
## # A tibble: 3 x 7
## # Groups:   month [1]
##        month captured events customers       mrr percent_of_events
##       <date>    <lgl>  <int>     <int>     <dbl>             <dbl>
## 1 2017-06-01    FALSE   1050      1036 19382.833        0.29812606
## 2 2017-06-01     TRUE   2326      2315 38838.333        0.66042022
## 3 2017-06-01       NA    146        21  4368.667        0.04145372
## # ... with 1 more variables: percent_of_mrr <dbl>
In June, there were 3522 churn events that accounted for $62K in lost MRR. Of those 3522 churn events, Around 30% came from subscriptions whose latest invoice was not paid.
Let’s dig in a little deeper into this data, and calculate the percent of total churn that is involuntary for subscriptions that are billed monthly and subscriptions that are billed annually.
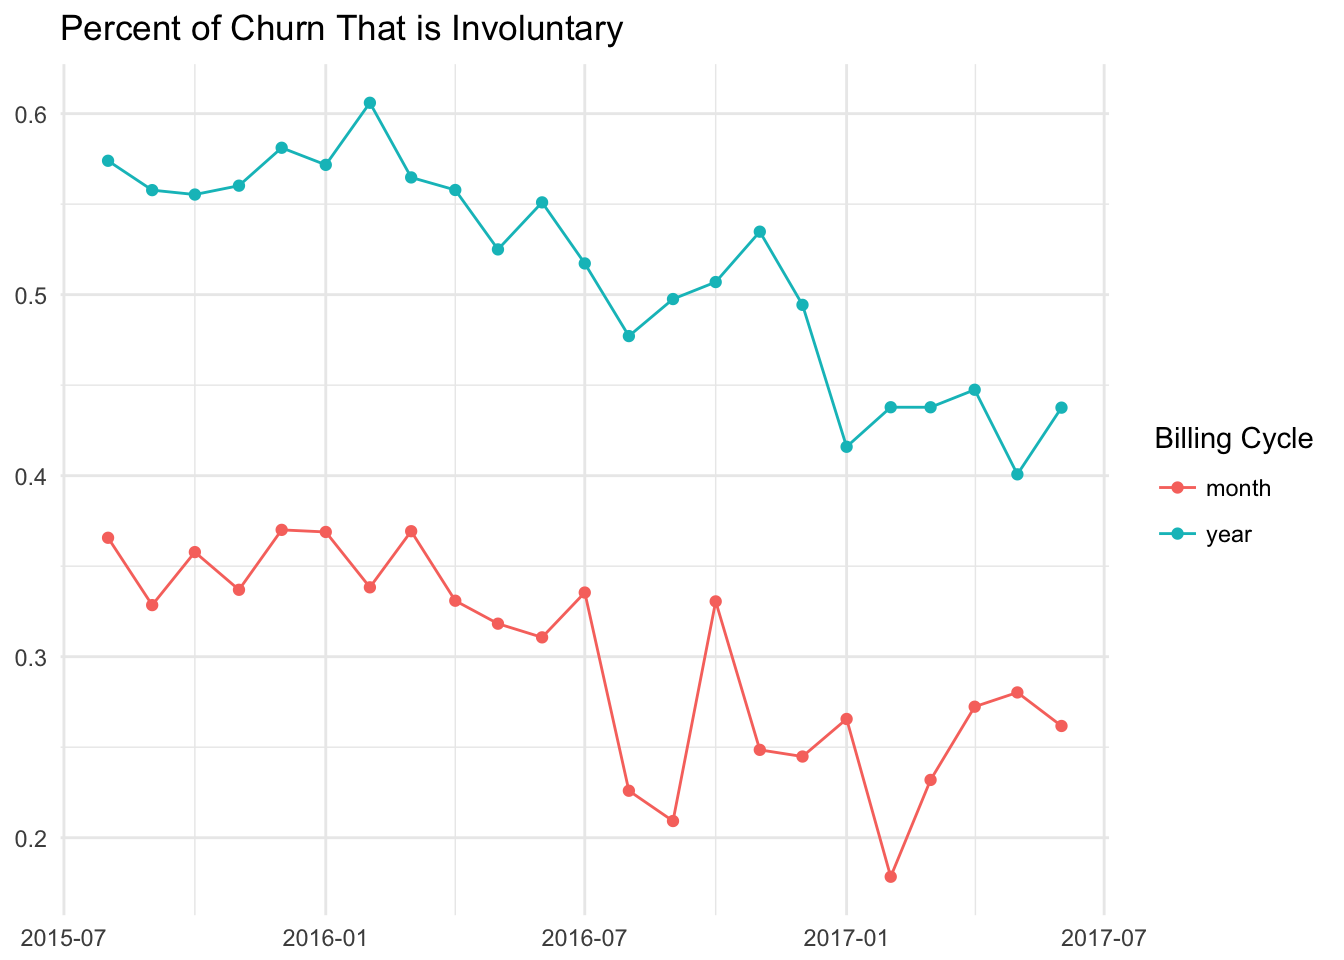
This graph makes it clear that involuntary churn is much higher for subscriptions that are billed annually. This makes sense intuitively, as there is a higher cost and a much longer time between payments. In February 2016, over 60% of churned subscriptions for annual plans ended with a failed payment!
How much MRR does this represent?
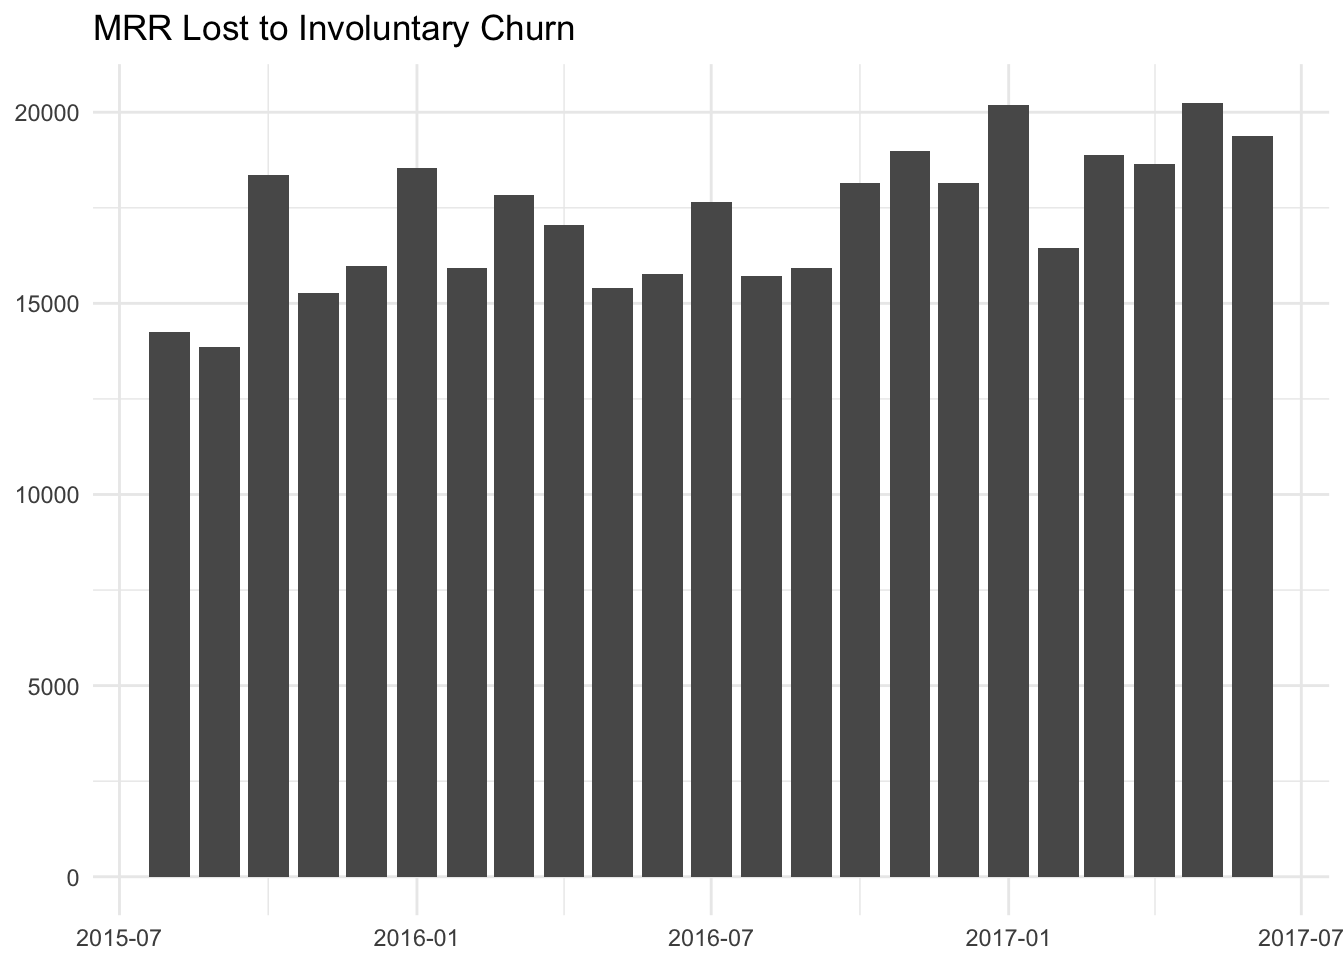
The MRR amount lost to involuntary churn is quite high. Around 15 to 20K is lost each month! This value is increasing, even though the percent of total churn that is involuntary is decreasing. This can occur when the value of each churn event increases, and the overall number of churn events also increases.
Payment information
Payments fail for different reasons, some of which we can control. We may be able to assume that charges are less likely to fail if we have more information about the customer, e.g. his or her address.
Let’s check this assumption by looking at our charges in the past, and see how many of them had infomation like addresses and zip codes. We can get this data by querying the tables in Stripe’s Sigma tool. We’ll use the following query to gather the number of charges, successful or failed, each month, as well as whether or not the cards had addresses and zip codes. We’ll also be able to segment by the card type.
with charge_information as (
  select
    date_trunc('month', charges.created) as month,
    charges.card_brand,
    charges.id as charge_id,
    charges.captured,
    charges.card_country,
    trim(charges.card_address_zip) as card_address_zip,
    trim(charges.card_address_line1) as card_address_line1
  from charges
  left join balance_transactions
    on charges.id = balance_transactions.source_id
)

select
  date_format(month, '%Y-%m') as month,
  coalesce(card_brand, 'Non-card or Other') as card,
  captured,
  card_country,
  length(card_address_zip) > 0 as has_zip,
  length(card_address_line1) > 0 as has_address,
  count(distinct charge_id) as charges
from charge_information
group by 1, 2, 3, 4, 5, 6
order by 1 desc
To begin, let’s start by just visualizing the percentage of charges that were captured over time.
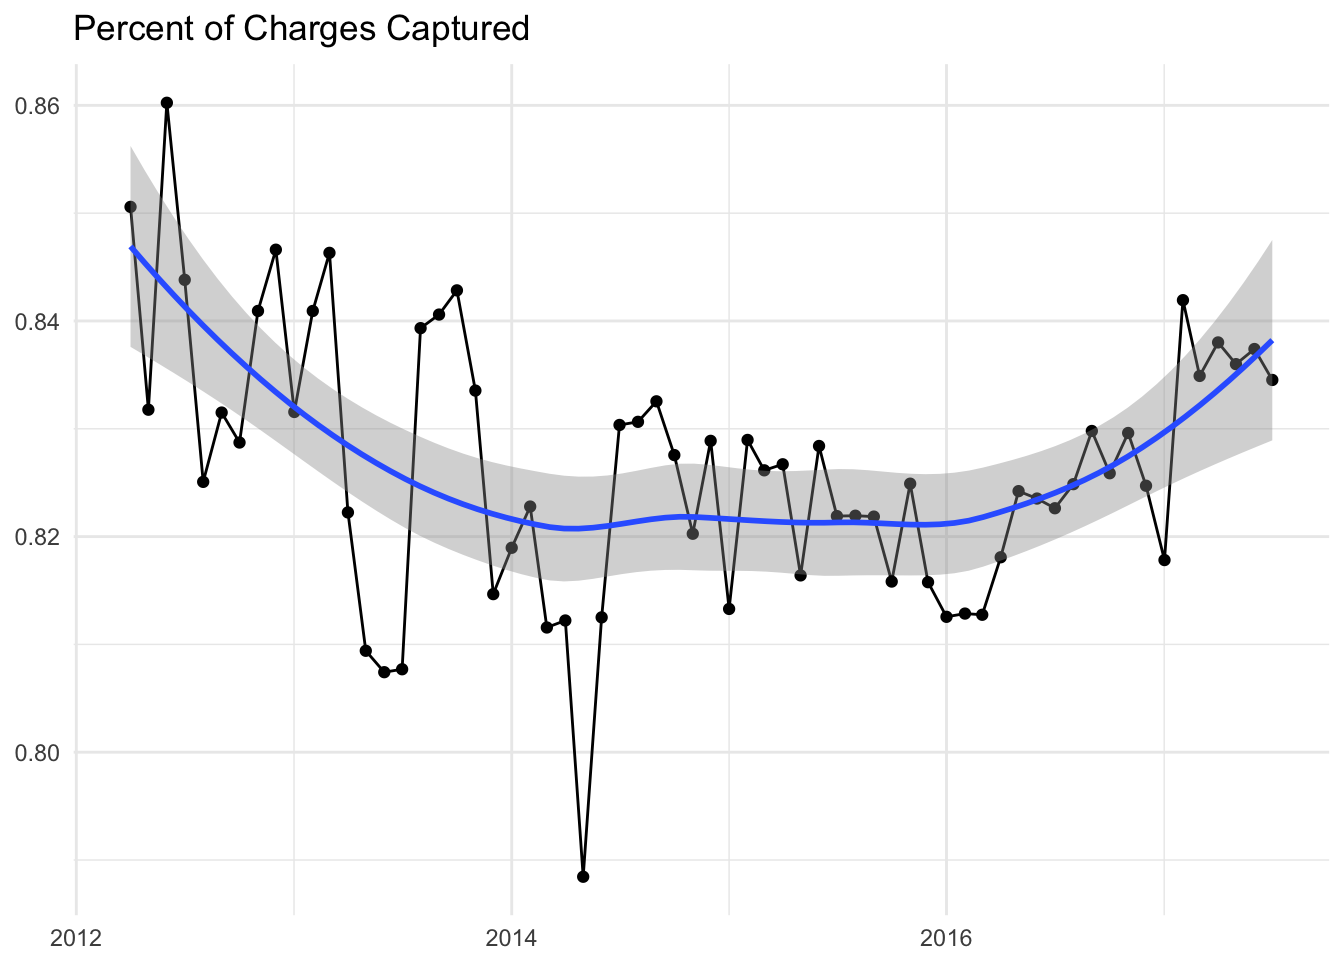
We can see that where was a decreasing trend from Buffer’s inception to the middle of 2014 - a decreasing percentage of charges were successfully paid. However, beginning around March 2016, the percentage of charges captured has been trending upward. We started collecting customers’ zip codes around March 2016, which may suggest that collecting zip codes decreased the rate of involuntary churn.
Let’s segment this data by whether or not we had the customer’s zip code at the time of the charge. We’ll filter to only graph data after March of 2016
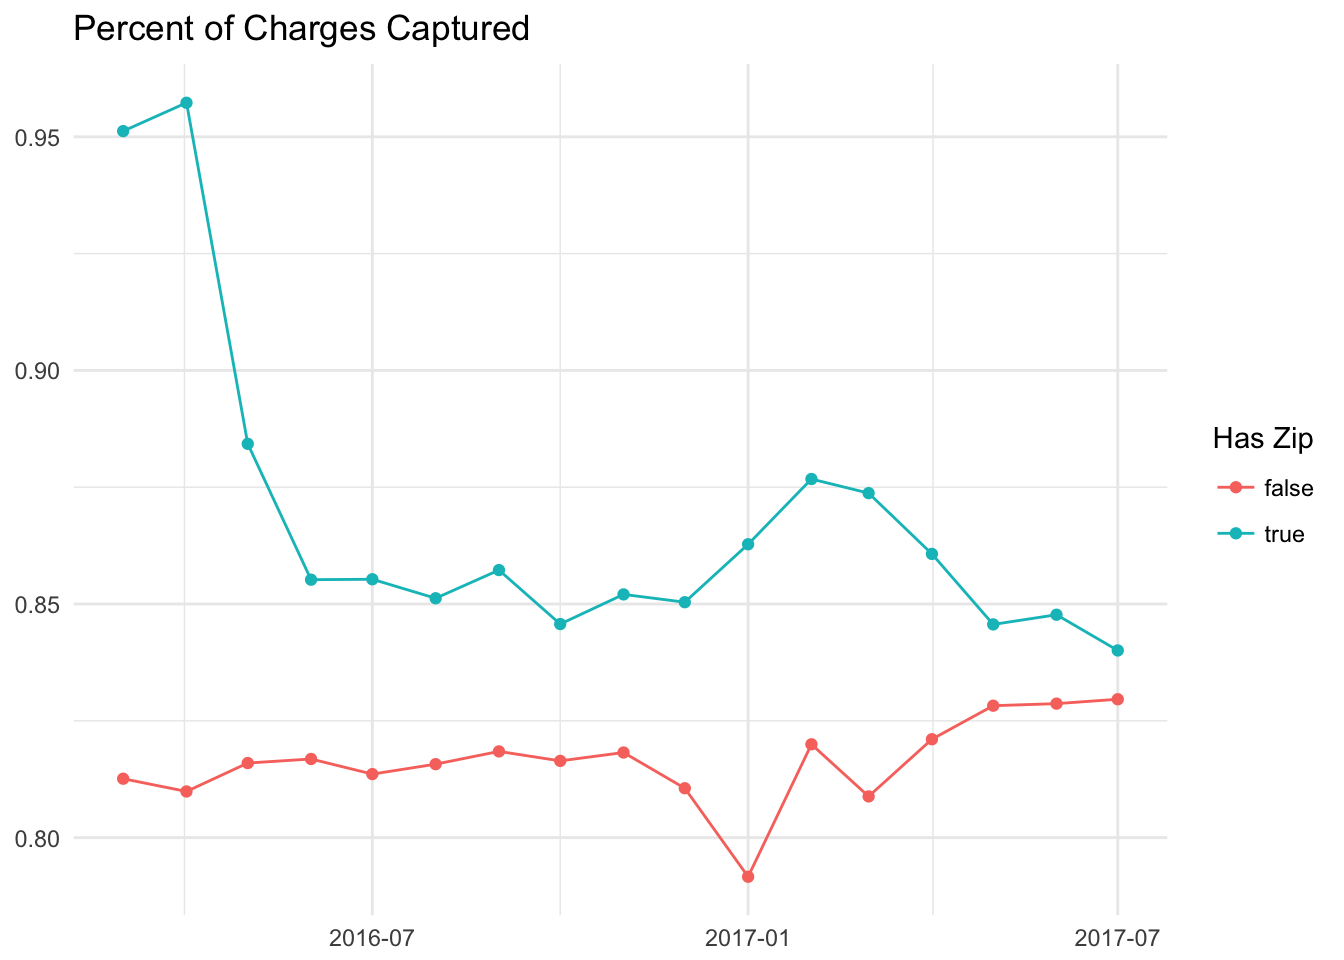
Wow, we can see clearly that charges in which we have users’ zip codes fail less often than charges in which we don’t. We can also segment the data by whether or not we collected the customers’ addresses, however it doesn’t quite seem like we’ve collected customers’ addresses.
Let’s see if the type of credit card makes any difference.
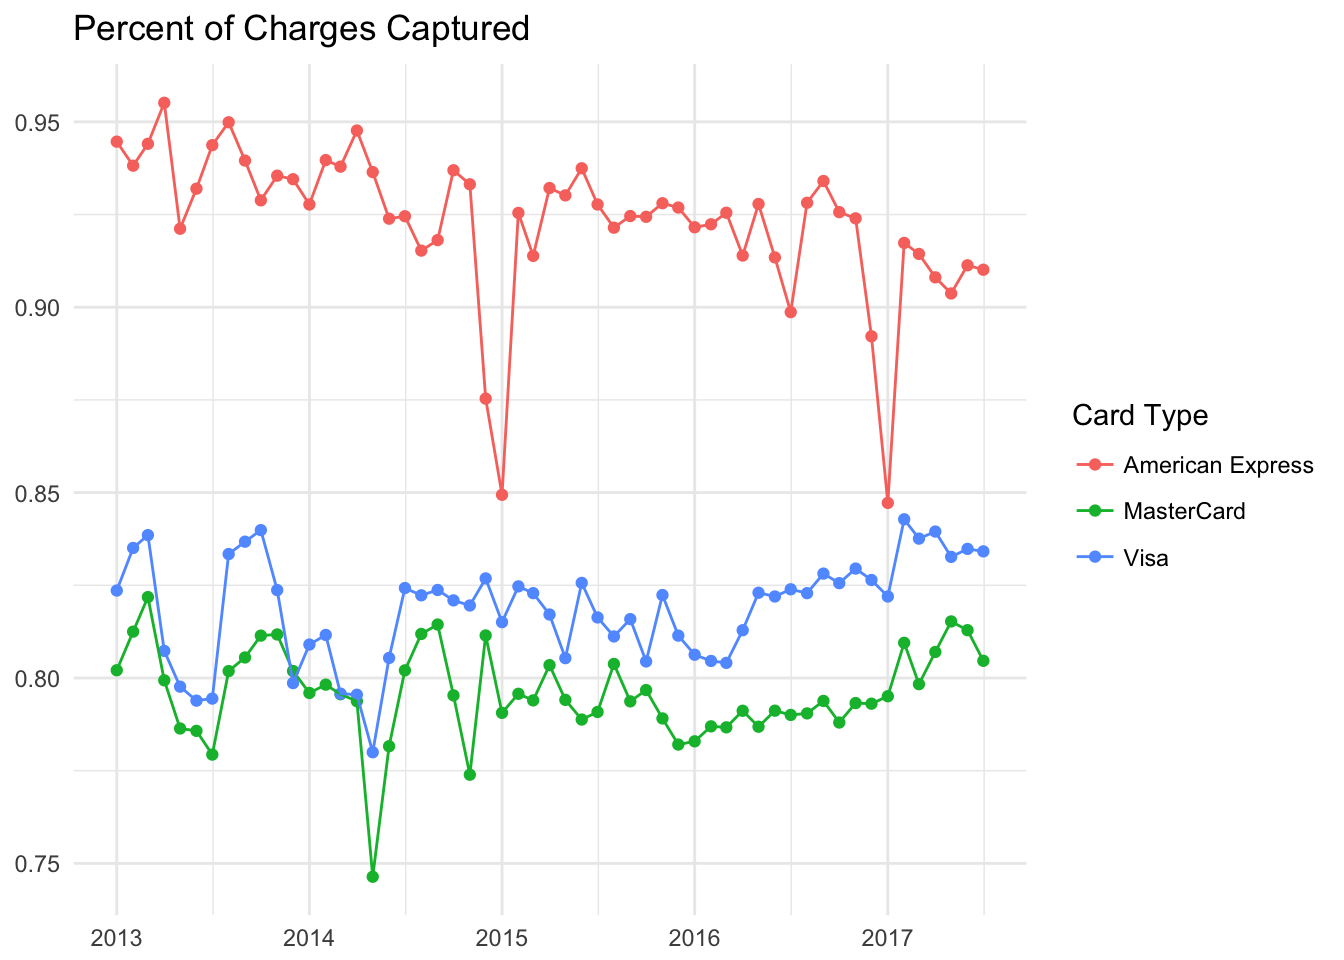
Certain types of credit cards clearly outperform others in terms of charges captured. AMEX cards have a significantly higher capture rate than Visa or Mastercard. Discover, Diners Club, and JBC all don’t seem to have large enough sample sizes to tell for sure.
Let’s plot the capture rate for each of these cards, and segment each by whether or not we had a zip code.
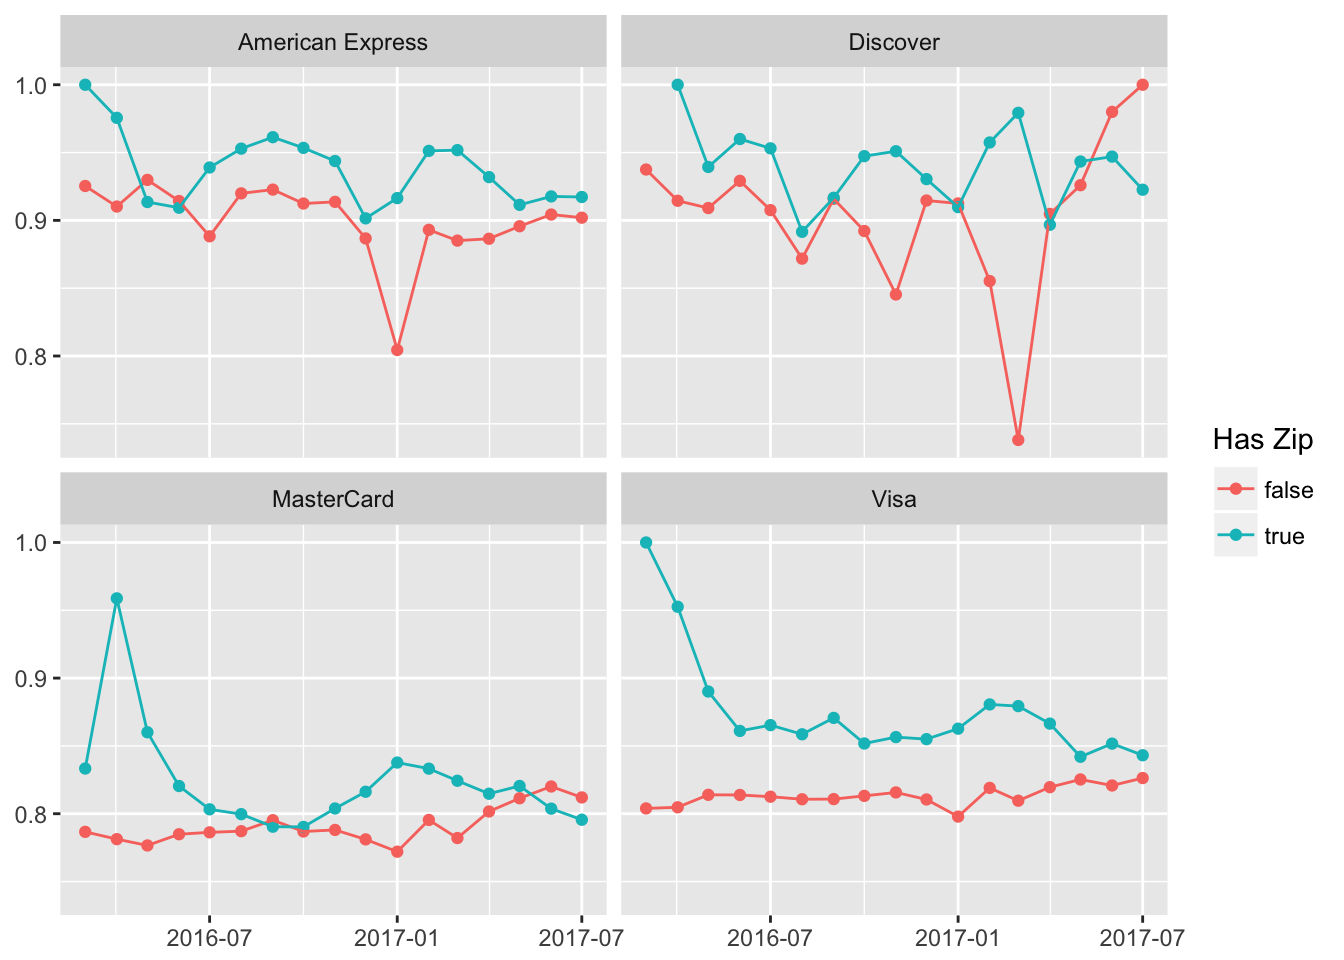
For each type of card, having the zip code improves the capture rate. Awesome! These graphs suggest that having more information decreases the likelihood of a failed payment.
Therefore I might suggest an experiment in which we also ask for users’ addresses, if they are in the US.
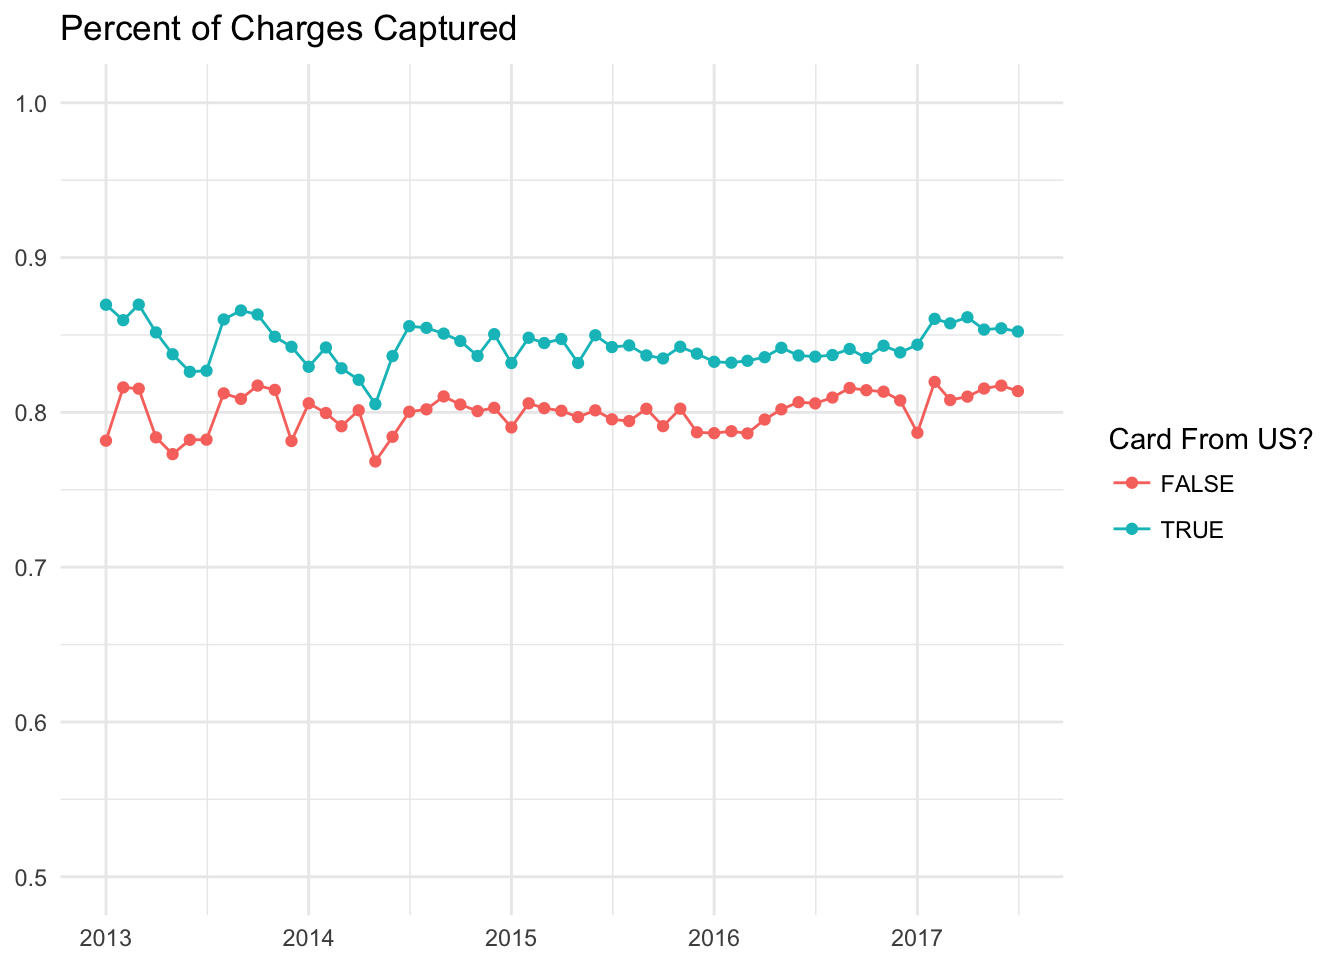
How does the country affect the success rate?
Let’s first plot out the success rate for US and non-US cards.
# determine if the card is from the US
payments <- payments %>% mutate(is_us = (card_country == 'US'))
Now let’s make the plot.
Now let’s plot out the success rate for each country that has over 3000 charges.
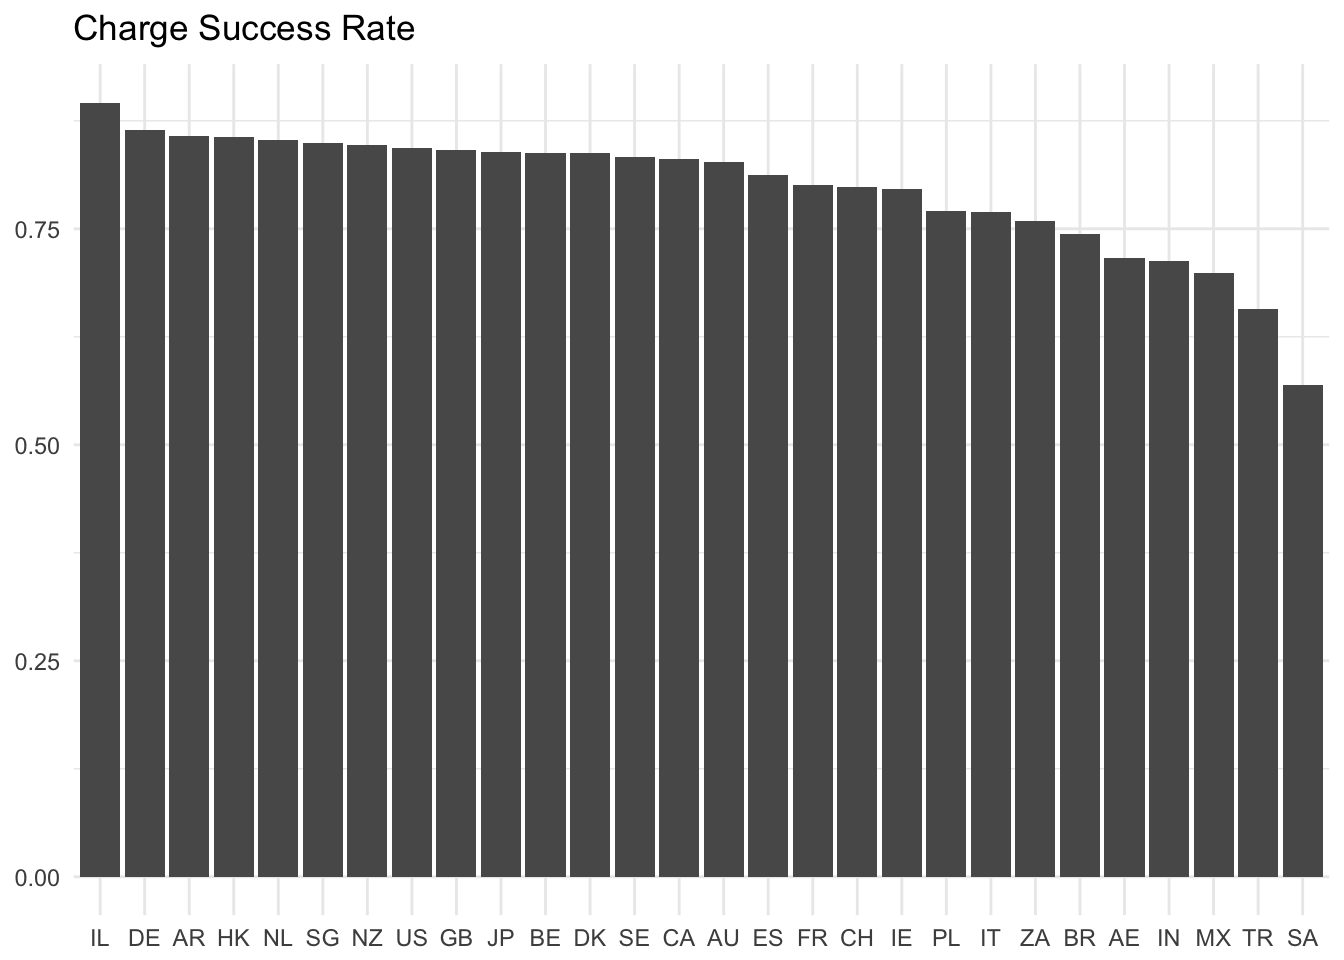
Israel, Germany, Argentina, Hong Kong, The Netherlands, Singapore, New Zealand, The United States, and Great Britain have the highest success rates, while Saudi Arabia, Turkey, Mexico, India, UAE, Brazil, and South Africa have the lowest success rates.
What effect to the reminder emails have?
This is harder to measure, but we can still do a bit of exploration with our dunning emails. We first need to gather the data, which we can do by querying the user_email_actions table.
select
    created_at
    , email
    , event_type
    , user_id
    , count(*)
from user_email_actions
where email like '%dunning%'
and created_at >= (current_date - 365)
group by 1, 2, 3, 4
We can quickly see how many of each email we’ve sent in the past year.
table(email_actions$email)##
## dunning-phase-1 dunning-phase-2
## 56507 28313
## dunning-phase-3 emails_dunning_phase_1_email
## 24612 4331
## emails_dunning_phase_2_email emails_dunning_phase_3_email
## 3015 1907
## emails_final_dunning_email
## 248Because it seems that there are different names for the same email, I’m going to rename them.
# Replace emails_dunning_x names
email_actions$email <- gsub("emails_dunning_phase_1_email", "dunning-phase-1", email_actions$email)
email_actions$email <- gsub("emails_dunning_phase_2_email", "dunning-phase-2", email_actions$email)
email_actions$email <- gsub("emails_dunning_phase_3_email", "dunning-phase-3", email_actions$email)
email_actions$email <- gsub("emails_final_dunning_email", "dunning-final-email", email_actions$email)
Now let’s count the emails again.
table(email_actions$email)##
## dunning-final-email dunning-phase-1 dunning-phase-2
## 248 60838 31328
## dunning-phase-3
## 26519It’s good to see the numbers decrease. This suggests that users took action by either updating their payment method or canceling their subscription. Now let’s look at the email actions for each email. To do this, let’s group by month and count the number of users that took each type of action.
# Group by month
actions_by_month <- email_actions %>%
  group_by(month, email, event_type) %>%
  summarise(users = n_distinct(user_id))
Now we need to spread the data, so that each month, email, and event_type combination has a user count in it’s own column.
library(tidyr)## Warning: package 'tidyr' was built under R version 3.4.1# Spread data
wide_actions <- actions_by_month %>%
spread(event_type, users)For some reason, we only have the proper email counts from May 2017 onwards! Let’s see if we can calculate open rates, after filtering out incomplete months.
# Filter out incomplete months and calculate open rate
wide_actions <- wide_actions %>%
filter(month >= '2017-05-01') %>%
mutate(open_rate = email_opens / emails,
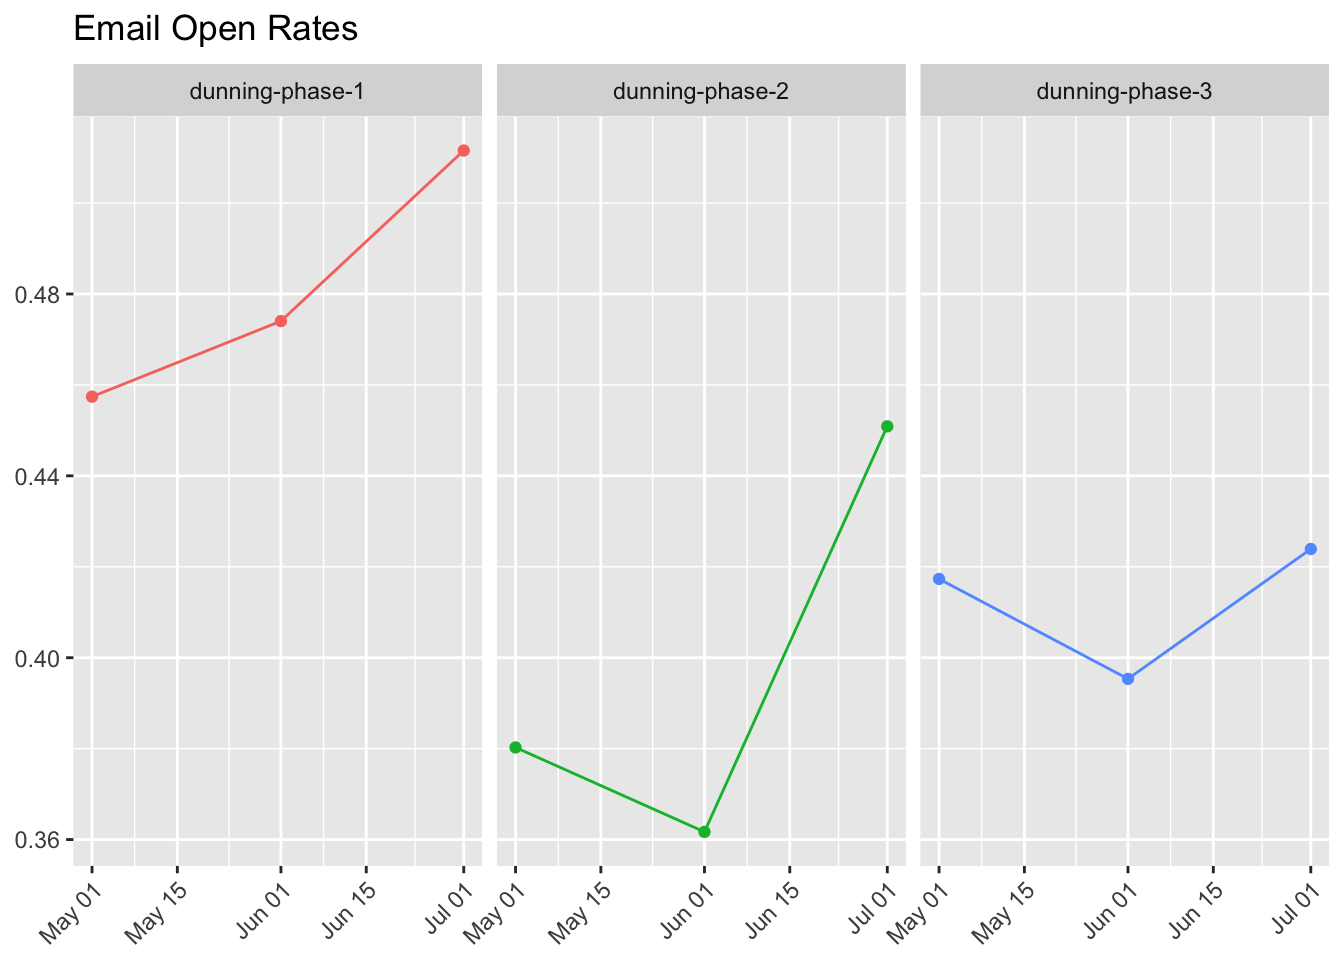
ctr = email_clicks / emails)Now let’s plot the open rates for each month.
What if we instead wanted to look at click through rates? We can define this as the proportion of users that were sent the email that clicked through the CTA.
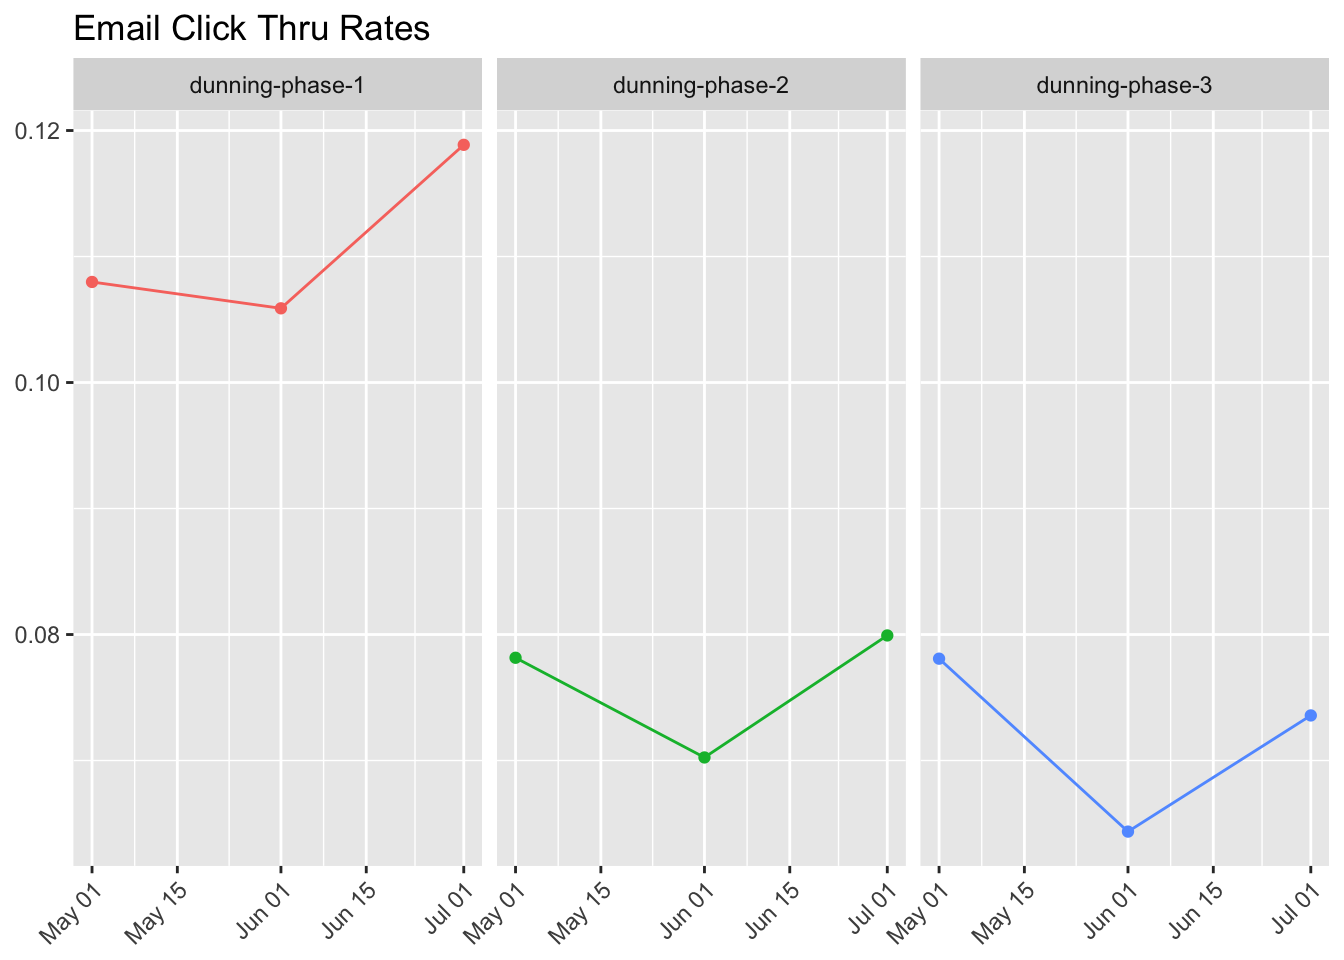
These seem like fairly decent open rates, but low click-thru rates. Unfortunately, we don’t track a client_id for these events, so I’m not sure how we can see how many of these emails were opened on a mobile device. We might need to use SendGrid or Mailchimp for that.
Conclusions
The data suggests that involuntary churn makes up a significant portion of our overall churn, over 30%. This ratio has been decreasing substantially over the past two years. Subscriptions that are billed annually have much higher involuntary churn rates than those charged monthly.
Involuntary churn accounts for around 15-20 thousand dollars in MRR lost each month.
Having the customer’s zip code decreases the rate in which payments fail, and I would suggest experimenting with collecting users’ addresses, to further decrease the failed payment rate.
Our dunning emails have relatively high open rates and decent click through rates, but we are unable to tell at the moment how many are opened on mobile devices. We are also unable to say, or estimate, the effects that the emails have on involuntary churn at this time. We may need to run a controlled experiment to make that estimate. :)
In the future, I would like to calculate involuntary churn rates segmented by country. A charge may be more likely to fail if the customer does not live in the United States. We may be able to mitigate some of this risk by asking for more information about the customer when we try to collect payments.