This question came to me last week from one of our product managers. Let’s set about answering it! To do so, we’ll gather updates sent in the past months from Tailored Posts sessions, calculate the average number of Twitter profiles selected for each user, then average that average. As of today, Tailored Posts has been rolled out to around 50% of Buffer users.

Findings
The vast majority of Tailored Posts sessions that include at least one Twitter profile selected only have a single Twitter profile selected. Only around 8% of sessions in the past month have had more than one Twitter profile selected. This still equates to millions of sessions – my back of the napkin estimate is around one million sessions with multiple Twitter profiles selected.
This makes sense to me, since most sessions come from users on the free plan. These users are less likely, or even unable, to have multiple Twitter profiles selected.
Data collection
We’ll need to load the libraries we use later on.
# load libraries
library(buffer)
library(dplyr)
library(ggplot2)
library(hrbrthemes)
library(scales)
Now let’s collecte the updates.
select
  m.update_id
  , m.composer_type
  , m.composer_session_created_at
  , m.composer_session_id
  , up.profile_id
  , up.profile_service
  , up.user_id
  , u.billing_plan
from dbt.multiple_composer_updates as m
inner join dbt.updates as up on m.update_id = up.id
inner join dbt.users as u on up.user_id = u.user_id
where m.composer_type in ('multiple_extension', 'multiple_web_dashboard')
and m.composer_session_created_at >= (current_date - 8)
and up.profile_service = 'twitter'
Great, we have two million Twitter updates to work with. At this point we can start grouping by the user_id and composer_session_id fields to find the number of Twitter profiles selected in each session.
# group by composer session
by_session <- posts %>%
  group_by(user_id, billing_plan, composer_session_id) %>%
  summarise(profiles = n_distinct(profile_id))

# group by user
by_user <- by_session %>%
  group_by(user_id, billing_plan) %>%
  summarise(avg_profiles = mean(profiles))
Exploratory Analysis
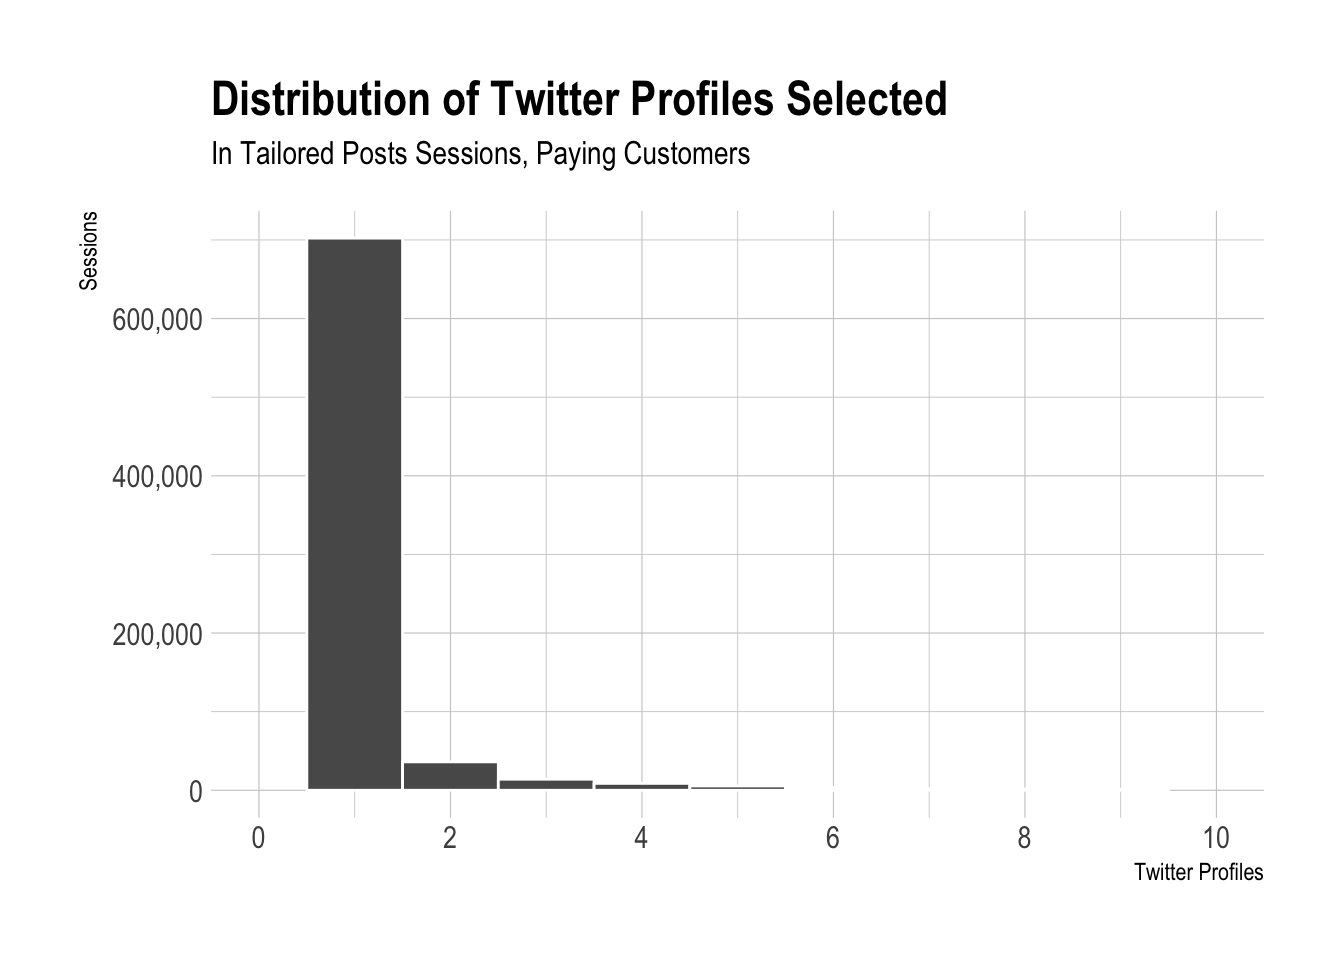
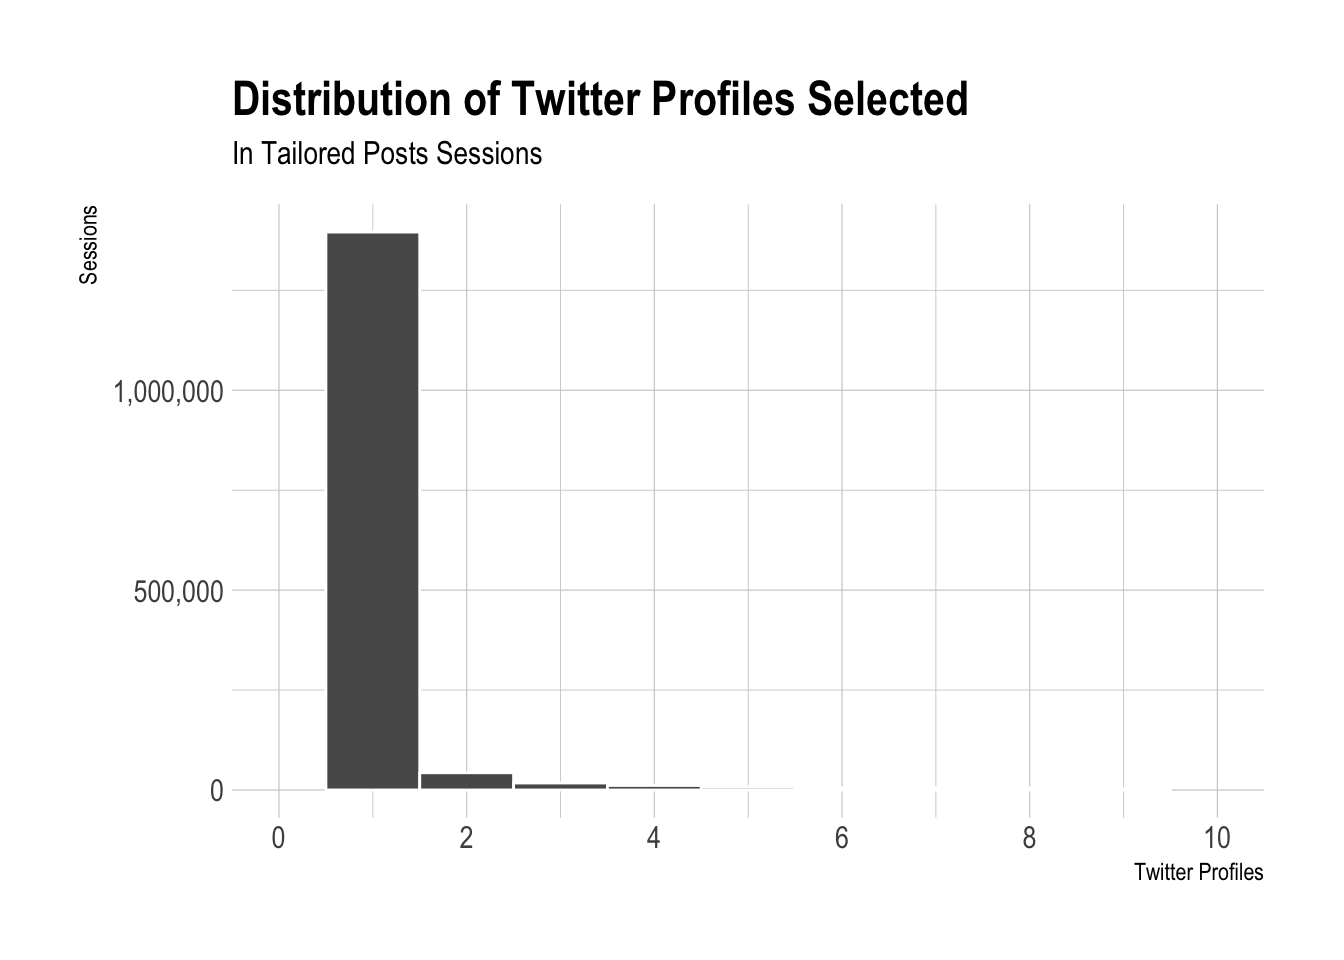
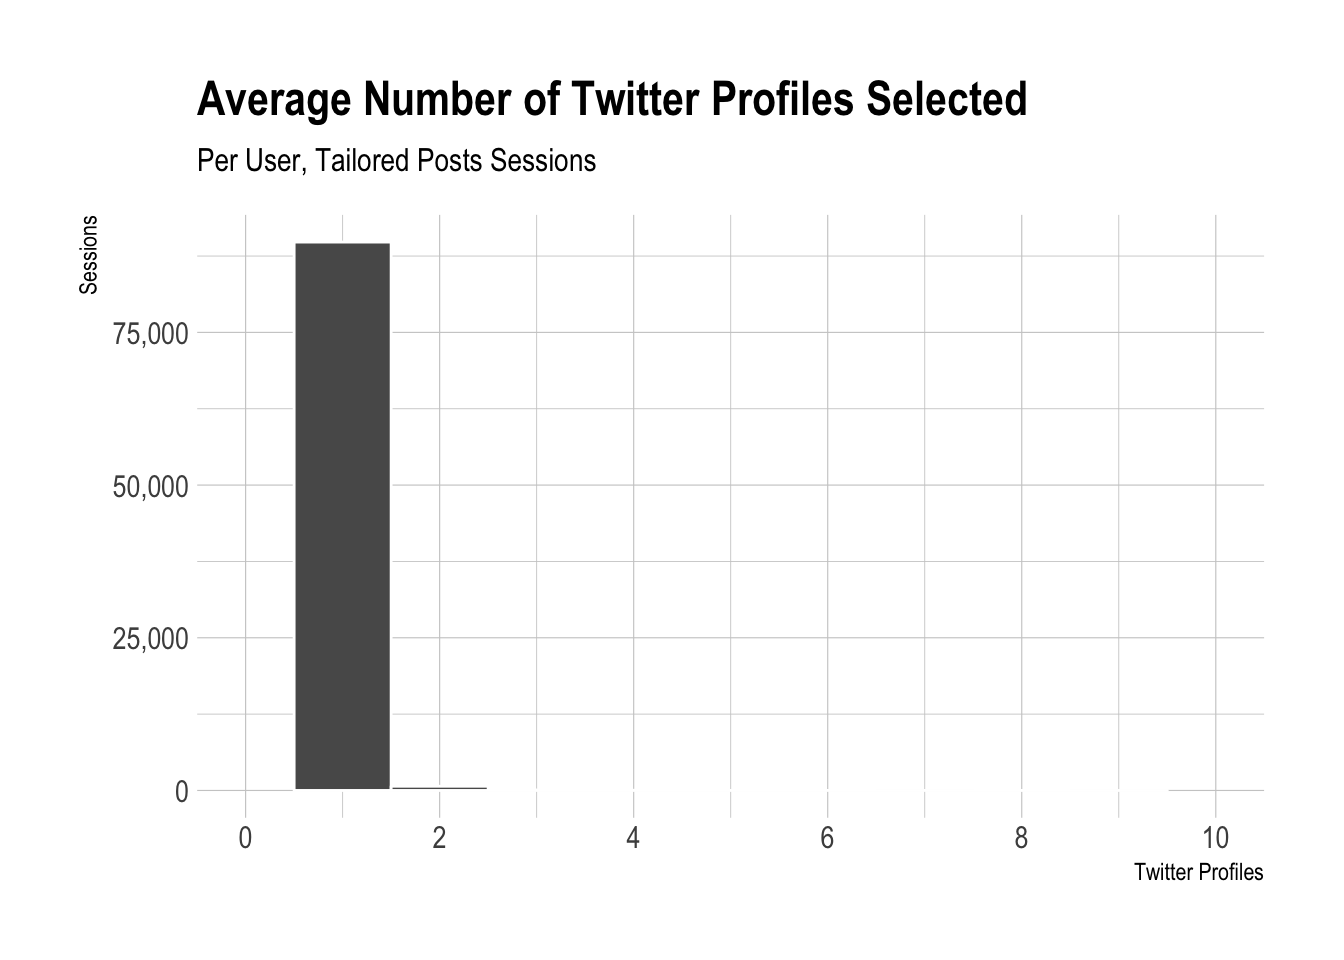
Now we can plot the overall distribution of the number of Twitter profiles selected. We can see in the graphs below that the vast majority of tailored posts sessions have only one Twitter profile selected.
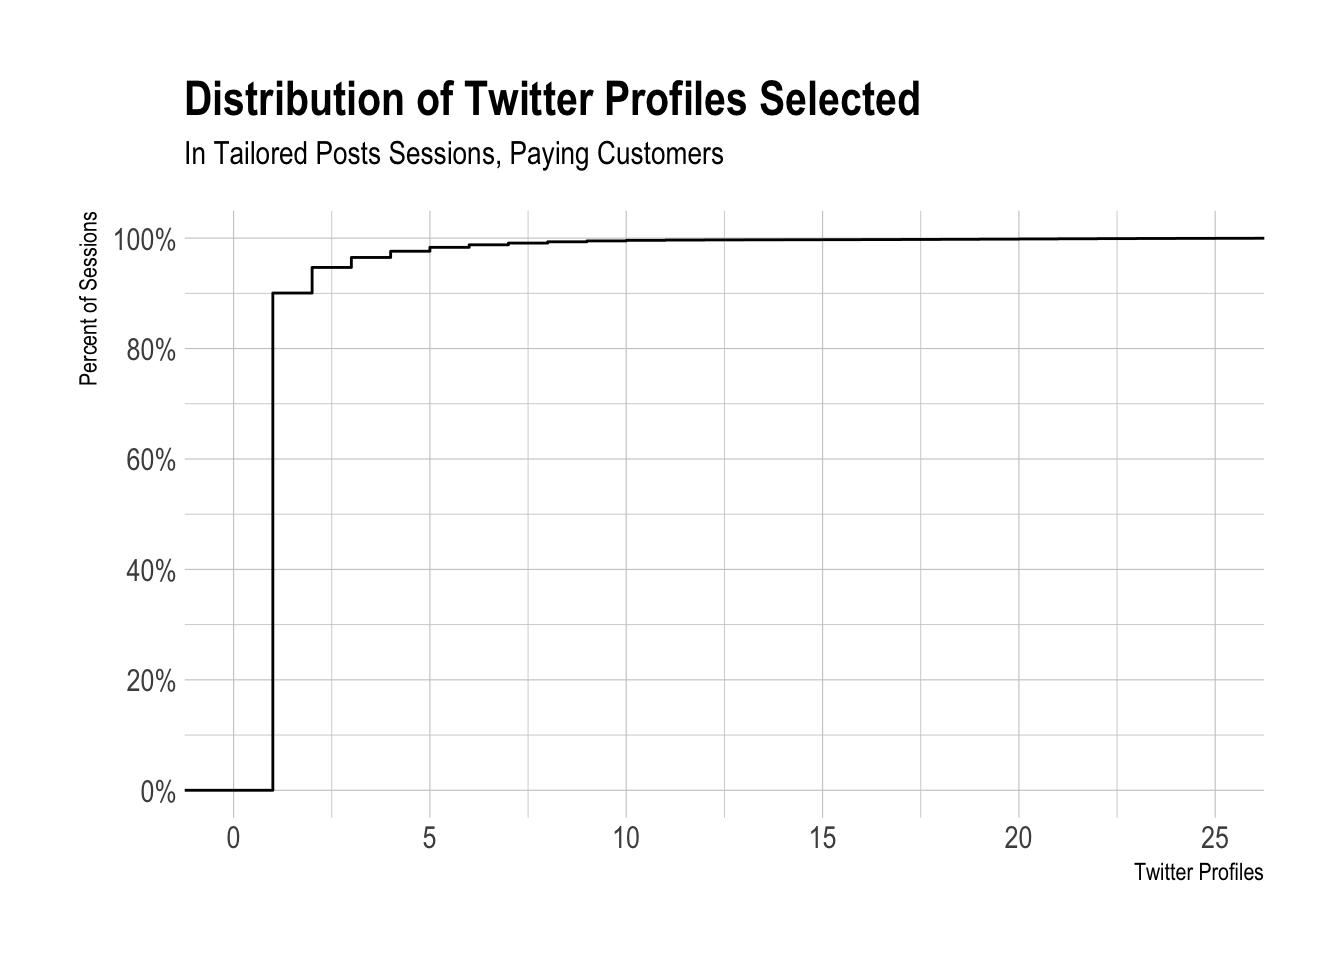
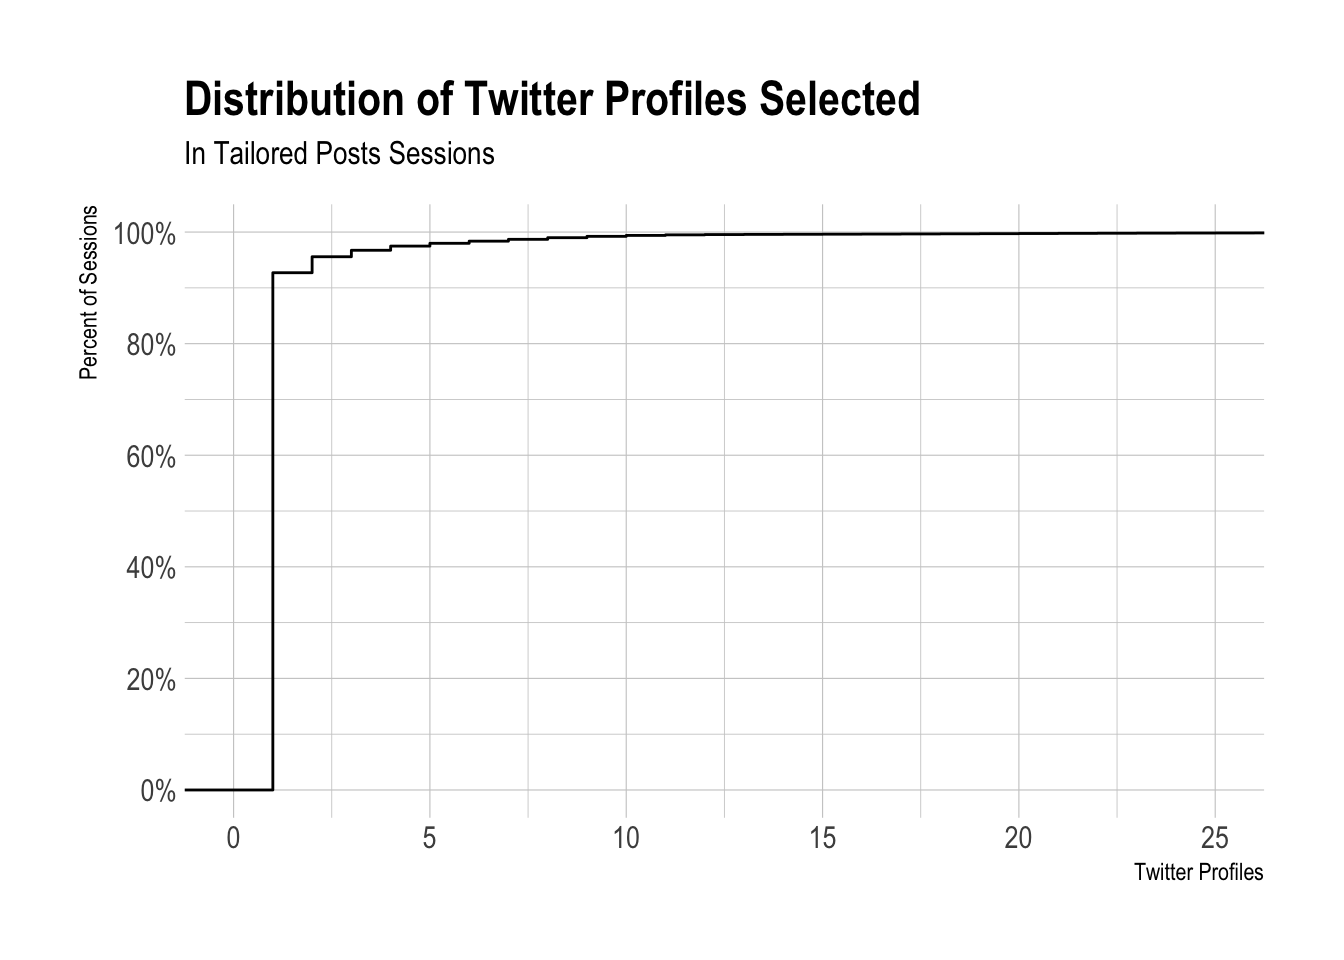
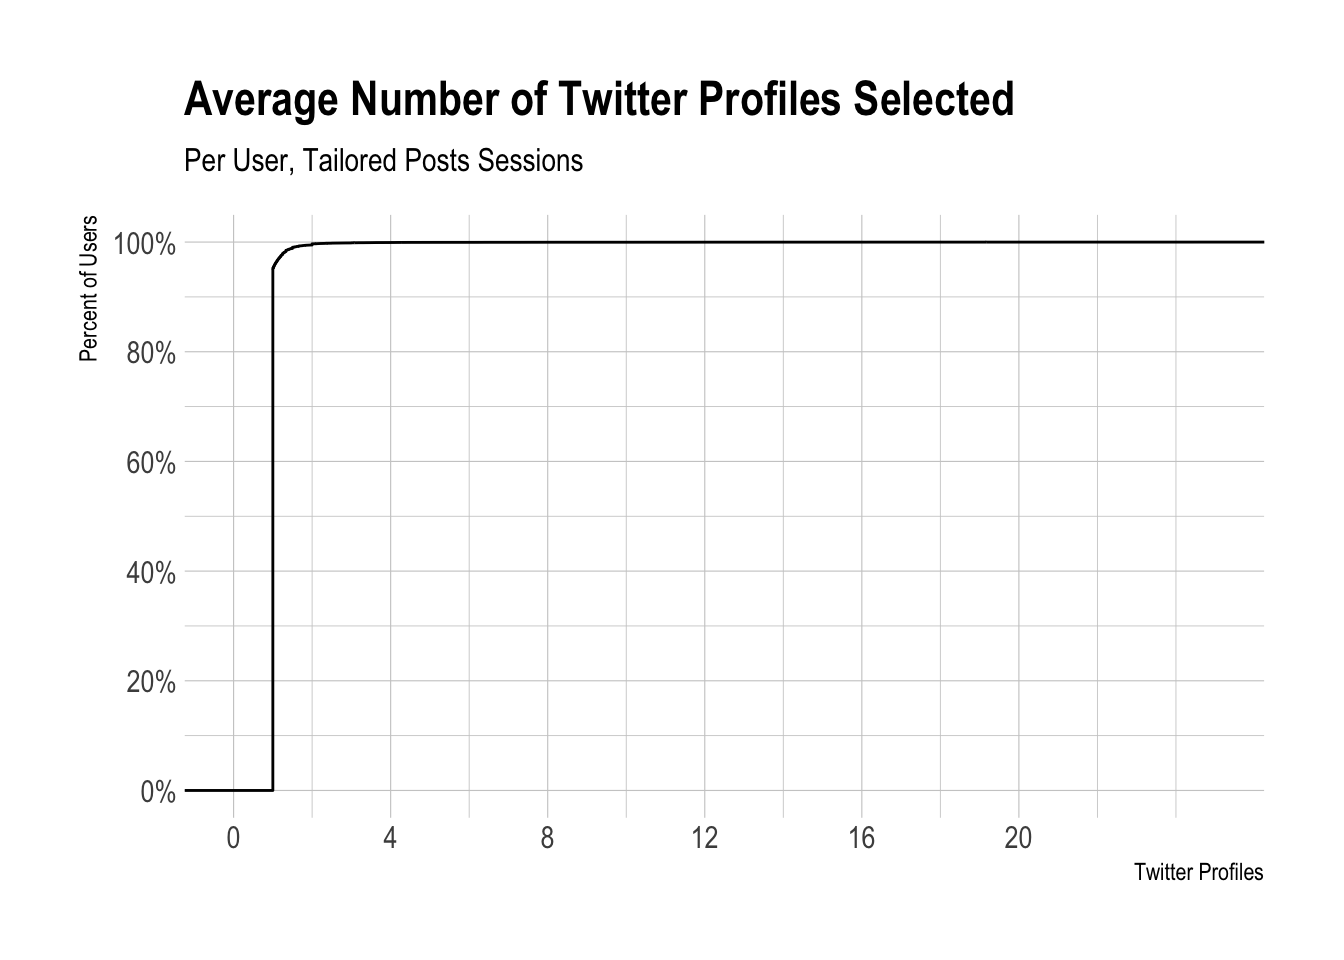
We can also plot the cumulative distribution function (CDF). We can see that over 90% of sessions in which at least one Twitter profile was selected, only a single Twitter profile was selected. Around 96% of sessions have two or less Twitter profiles selected, and around 98% of sessions had five or less Twitter profiles selected.
We can also count the absolute number of sessions in which at least two Twitter profiles were selected.
# count sessions with at least two twitter profiles
table(by_session$profiles >= 2)
##
## FALSE TRUE
## 1395682 109713Let’s also look at the absolute number of sessions in which at least five Twitter profiles were selected.
# count sessions with at least five twitter profiles
table(by_session$profiles >= 5)
##
## FALSE TRUE
## 1467526 37869We can break this down by plan.
# determine if five profiles are selected
by_session <- by_session %>%
  mutate(has_two_profiles = profiles > 1,
         has_five_profiles = profiles >= 5)

# break down by plan
by_session %>%
  group_by(billing_plan, has_five_profiles) %>%
  summarise(users = n_distinct(user_id),
            sessions = n_distinct(composer_session_id)) %>%
  filter(has_five_profiles)
## # A tibble: 9 x 4
## # Groups: billing_plan [9]
## billing_plan has_five_profiles users sessions
## <chr> <lgl> <int> <int>
## 1 agency T 21 1115
## 2 awesome T 109 3572
## 3 business T 19 3524
## 4 enterprise200 T 1 10
## 5 enterprise300 T 1 14
## 6 enterprise400 T 1 88
## 7 enterprise600 T 1 1
## 8 individual T 78 19342
## 9 small T 60 10203Let’s count the number of users that had at least one session in which multpiple Twitter profiles were selected.
by_session %>%
  group_by(has_two_profiles) %>%
  summarise(users = n_distinct(user_id),
            sessions = n_distinct(composer_session_id)) %>%
  filter(has_two_profiles)
## # A tibble: 1 x 3
## has_two_profiles users sessions
## <lgl> <int> <int>
## 1 T 4381 109713Let’s try a slightly different approach. Instead of plotting the distribution of the number of Twitter profiles selected for all composer sessions, we can look at the distribution of the average number of Twitter profiles selected per user. This way, users that have posted very frequently will have less of an influence on the distribution.
Let’s see how many users had two or more Twitter profiles selected on average in the past week.
# how many users had two or more Twitter profiles selected on average
table(by_user$avg_profiles > 2)
##
## FALSE TRUE
## 90361 291# determine if two profiles are selected
by_user <- by_user %>%
mutate(has_two_profiles = avg_profiles >= 2,
has_three_profiles = avg_profiles >= 3)
# break down by plan
by_user %>%
group_by(billing_plan, has_three_profiles) %>%
summarise(users = n_distinct(user_id)) %>%
filter(has_three_profiles)## # A tibble: 8 x 3
## # Groups: billing_plan [8]
## billing_plan has_three_profiles users
## <chr> <lgl> <int>
## 1 agency T 16
## 2 awesome T 43
## 3 business T 7
## 4 enterprise200 T 1
## 5 enterprise300 T 1
## 6 enterprise400 T 1
## 7 individual T 51
## 8 small T 22Average Number of Twitter Profiles Selected Per User
We’ll use the same techniques, but use the by_user dataframe we created earlier. We can see that the distribution is even more heavily skewed to the left!
The CDF below is pretty interesting, around 99% of users have had two or less Twitter profiles selected (on average) in thier Tailored Posts sessions.
Removing Free Plan Users
What would the distribution look like for users on paid plans? Similar story here.