Buffer started using Slack (again) on Thursday, June 2, 2016. Slack makes available some great data to all members of the team, so I thought it would be fun to analyze some of Buffer’s usage in the past couple of years.
Transparency is one of our core values, so it is always good to check in and see how we’re doing on that front. In this analysis, we will look at message frequency over time, the percentage of messages sent in private and public channels, and the percentage of messages sent in DMs.
To collect the data, we simply export a CSV from this site and read it into our R session. The data includes daily statistics for our Slack usage, including the number of active users, number of messages sent in public, private, and shared channels, the number of messages shared in DMs, and many other interesting metrics.
# read csv
slack <- read.csv('~/Downloads/slack.csv', header = TRUE)
We can do a bit of cleaning, especially with the column names.
# change column names
colnames(slack) <- safe_names(colnames(slack))

# replace x_of_
colnames(slack) <- gsub("x_of_", "", colnames(slack))

# set date as date object
slack$date <- as.Date(slack$date, format = "%Y-%m-%d")

# filter out dates before June 2, 2016
slack <- filter(slack, date >= "2016-06-02")
We also need to derive the week from the date, as we will look only at weekly usage.
# derive week
slack$week <- floor_date(slack$date, unit = "week")

# group usage by week
weekly_usage <- slack %>%
  filter(week != min(week) & week != max(week)) %>%
  group_by(week) %>%
  summarise(active_users = max(weekly_active_users),
            users_posting_messages = max(weekly_users_posting_messages),
            messages_in_public_channels = sum(messages_in_public_channels),
            messages_in_private_channels = sum(messages_in_private_channels),
            messages_in_shared_channels = sum(messages_in_shared_channels),
            messages_in_dms = sum(messages_in_dms),
            public_channels = max(public_workspace_channels),
            messages_from_apps = sum(messages_from_apps)) %>%
  mutate(total_messages = messages_in_public_channels +
           messages_in_private_channels +
           messages_in_shared_channels +
           messages_in_dms)
Now we’re ready for some exploratory analysis.
Number of Messages over Time
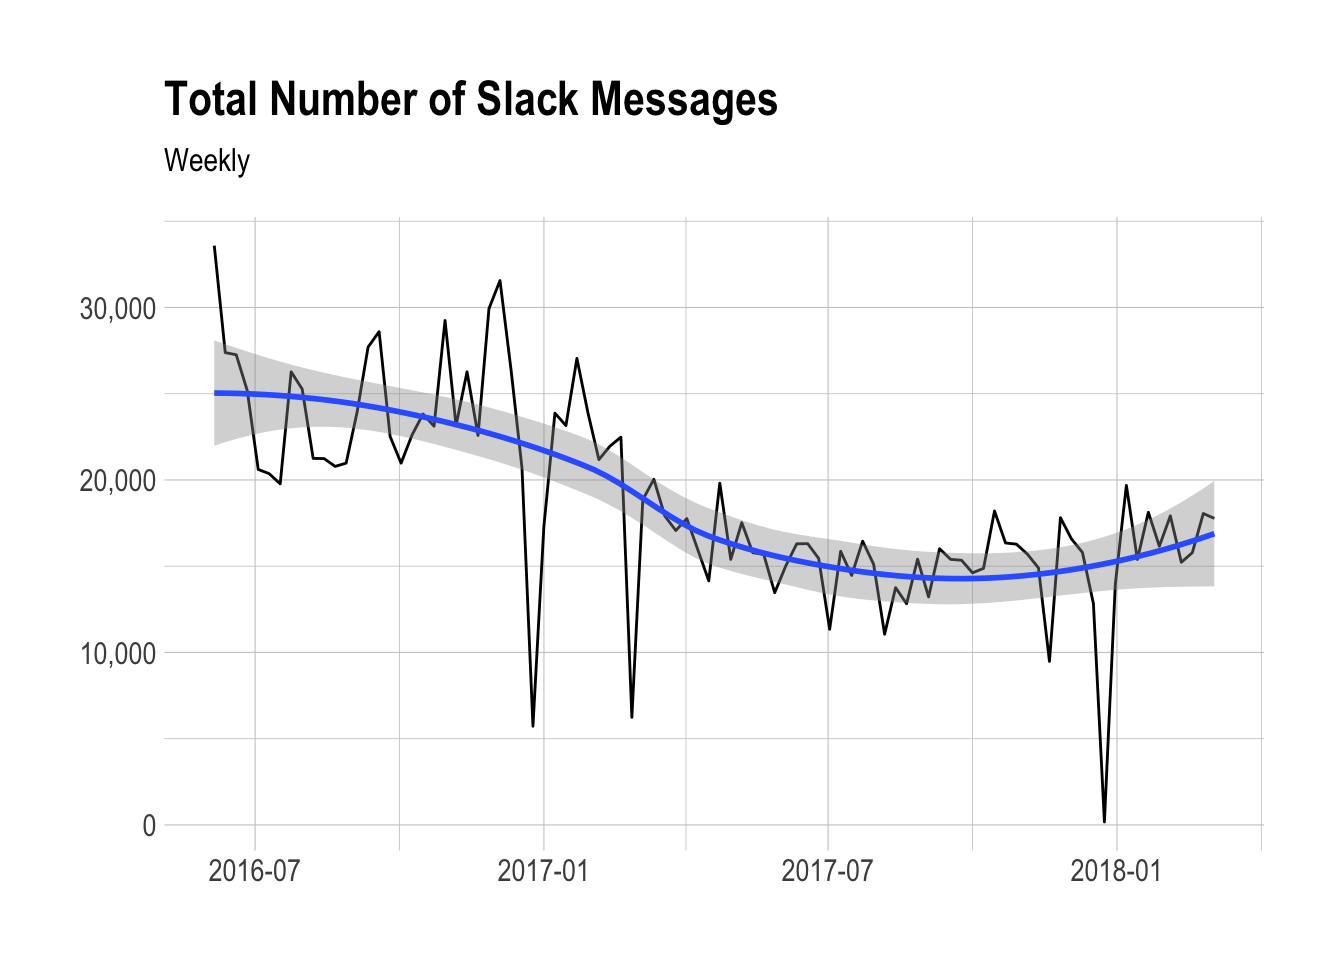
Let’s begin by plotting the total number of messages over time. In the graph below we can see that the total number of messages sent, excluding messages from bots and apps, has decreased significantly since mid-2016, from around 25 thousand per week to around 15 thousand per week.
This makes sense. As a fully remote and distributed company, we made a concerted effort to communicate more asynchronously - it’s cool to see this show up in the data, although it makes for a more lonely Slack.
We can also see the low point that occurred when Buffer closed down for the week over the holidays. :)
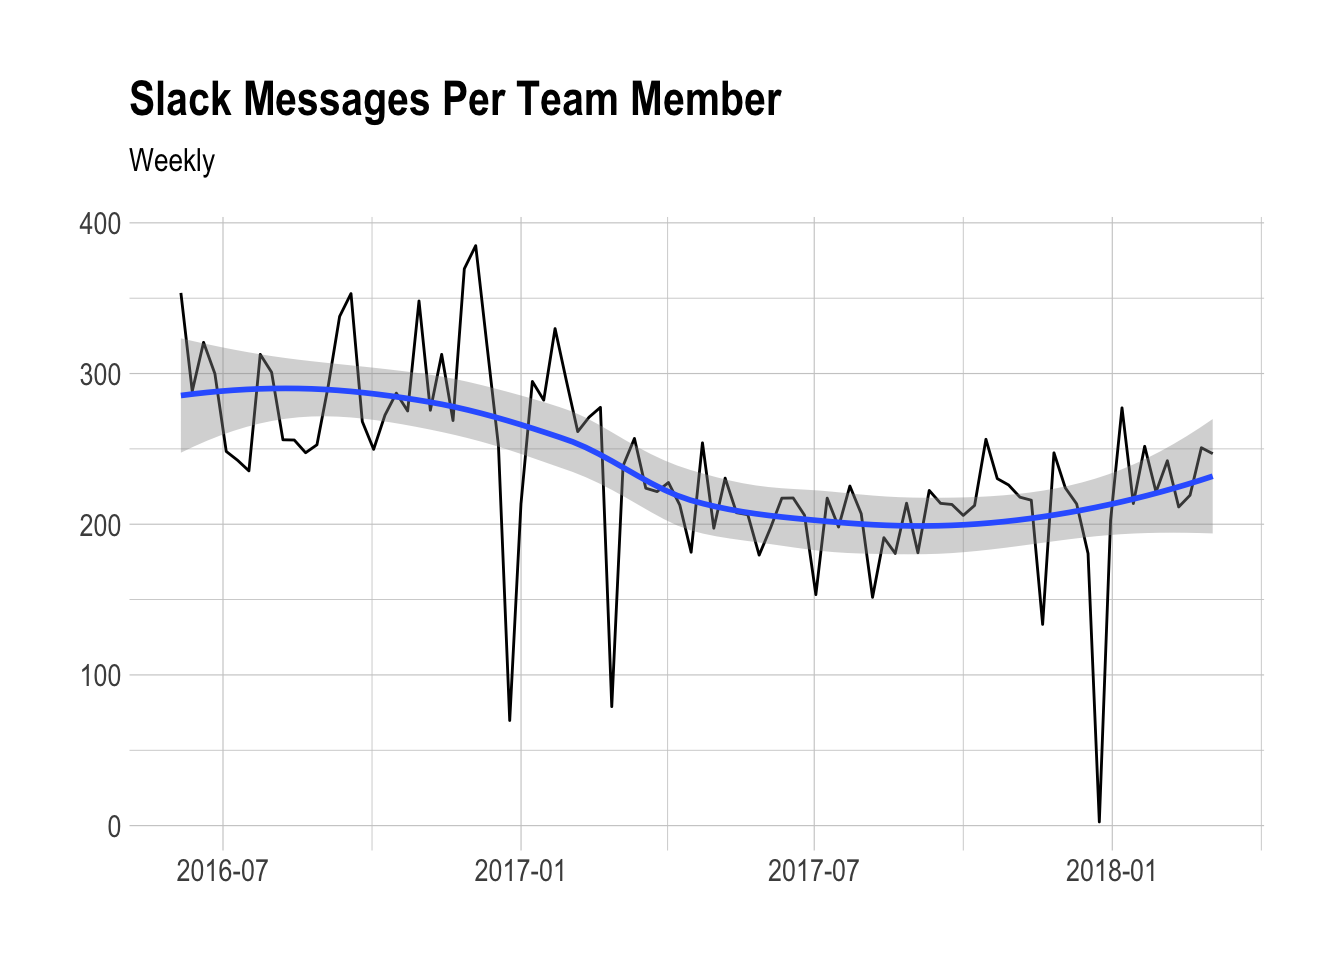
We can also control for team size by looking at the weekly number of messages sent per active user. We see a similar trend. There is a substantial decrease in the number of messages sent per active user.
Public vs Private vs DM
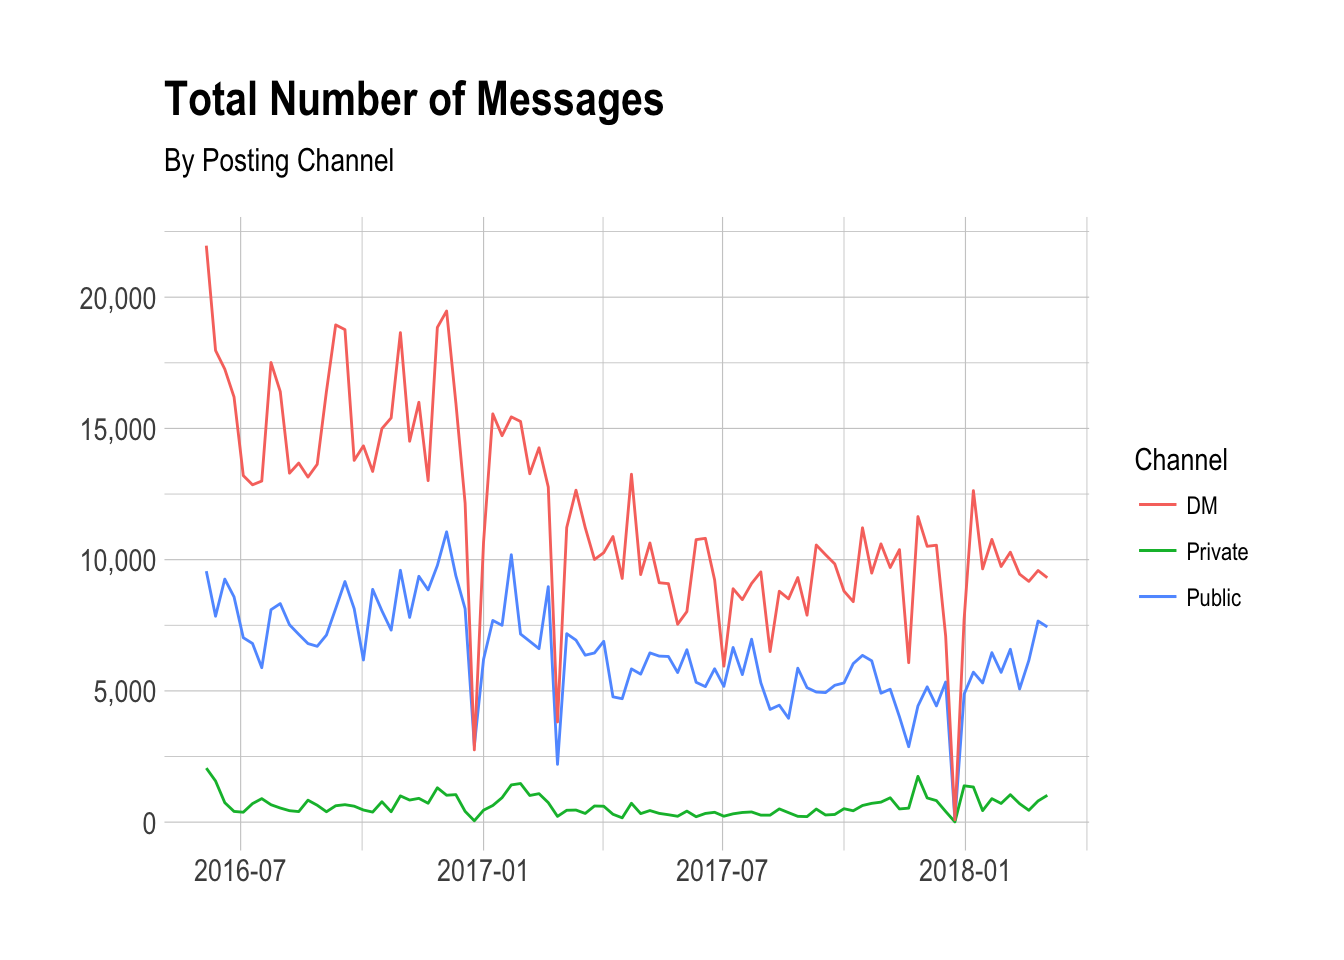
We should also examine the total number of messages sent in public channels, private channels, and DMs. Somewhat surprisingly, most messages are sent in DMs. The gap between the number of messages sent in DMs and the number of messages sent in public channels seems to have decreased somewhat since 2016, however it is still substantial.
Let’s look at the percentage of messages that are posted in public, private, and DM channels. To do this, we need to tidy the data a little bit with tidyr’s gather function.
# tidy data
weekly_usage <- weekly_usage %>%
  gather(channel_type, messages, messages_in_public_channels:messages_in_dms)
Nice! Now, let’s make a big assumption and label all messages sent in public channels “transparent” and call those in DMs and private channels not transparent. We can then plot the percentage of messages that are “transparent” over time. I acknowledge that this is probably a gross over-simplification.
In recent weeks, we can see an increase in the percentage of messages being shared in public channels. There are a lot of key projects happening right now, including Instagram direct posting, Twitter automation policy changes, and pricing changes. These have resulted in more new public channels and more messages being sent in public channels.
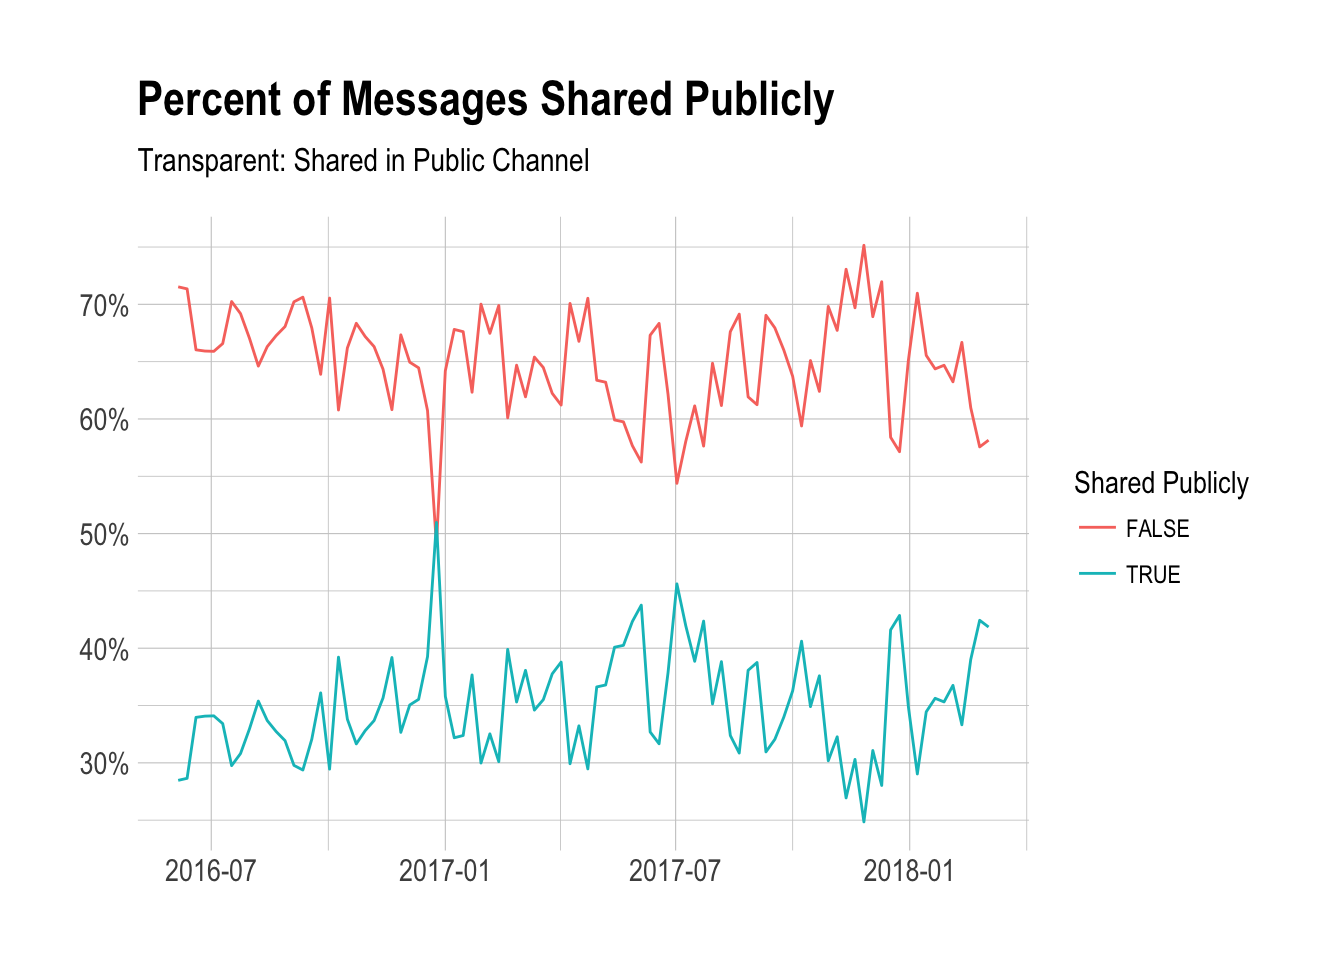
We can see that there is quite a large gap. For the most part, with exceptions, less than 40% of all messages are shared “transparently”. On average, around 65% of all Slack messages have been sent in private channels and DMs. Just to reiterate, I know that many DMs wouldn’t be beneficial for the team to see publicly and would only add clutter and noise. I chat with friends in DMs all the time!