In recent times we’ve seen MRR growth that is roughly linear. This wasn’t always the case - Buffer has had periods of higher growth and periods of low growth. We weren’t always growing MRR by 25-30K each month.
In this analysis we’ll try to identify points of inflection at which growth in MRR changed significantly. We’ll use methods in the changepoint package to identify points at which there is a shift in the amount of MRR growth.
Data collection
We’ll use data from this look, which shows Stripe MRR amounts since January 2012.
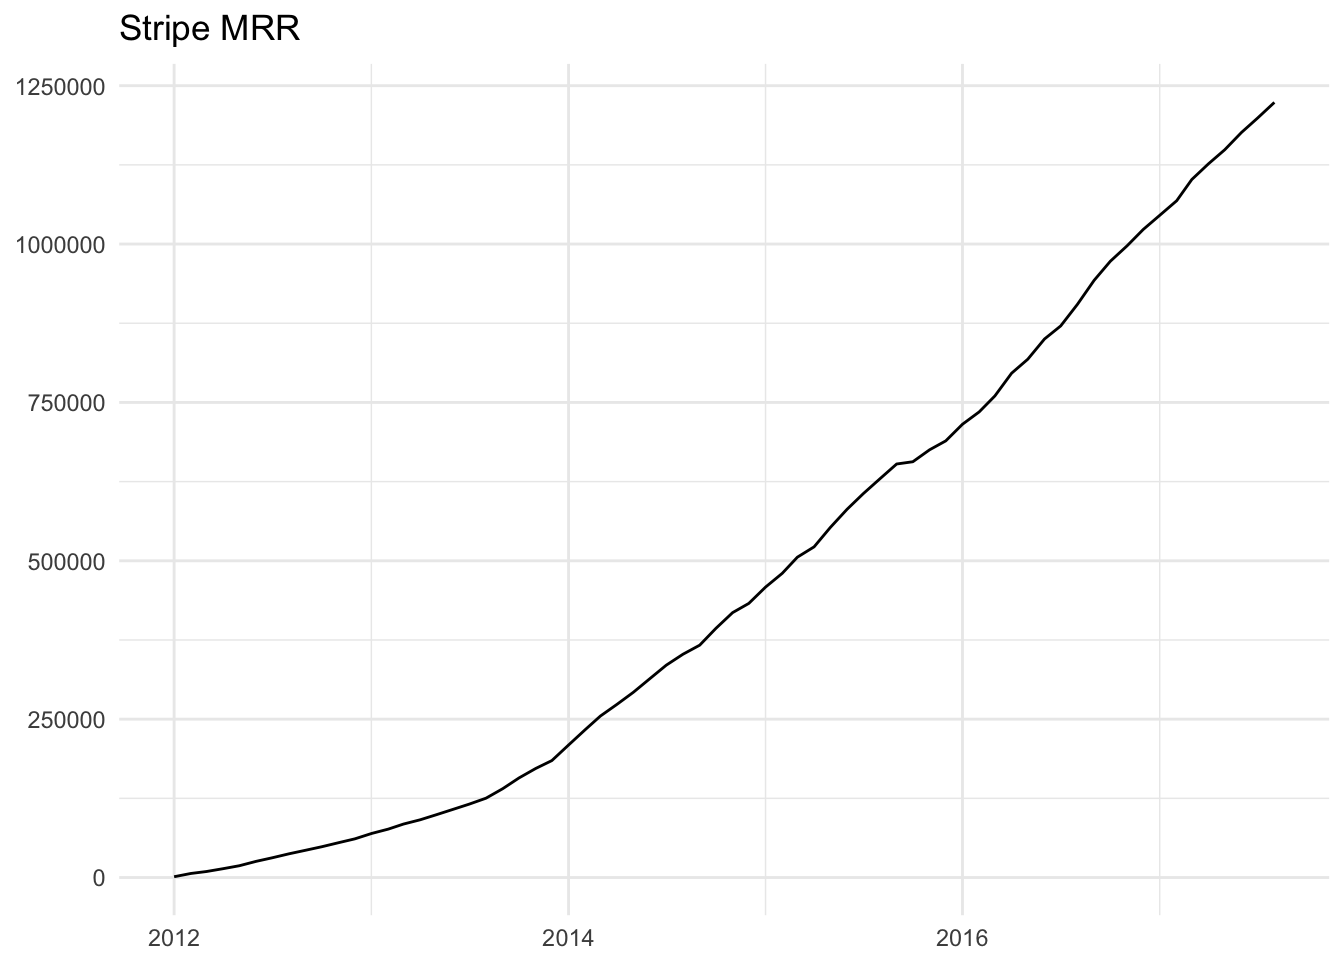
This plot has the shape of a hockey stick, with a period of exponential growth around the end of 2013 and more-linear growth since then. It will be useful to plot monthly MRR growth, and how that has changed over time.
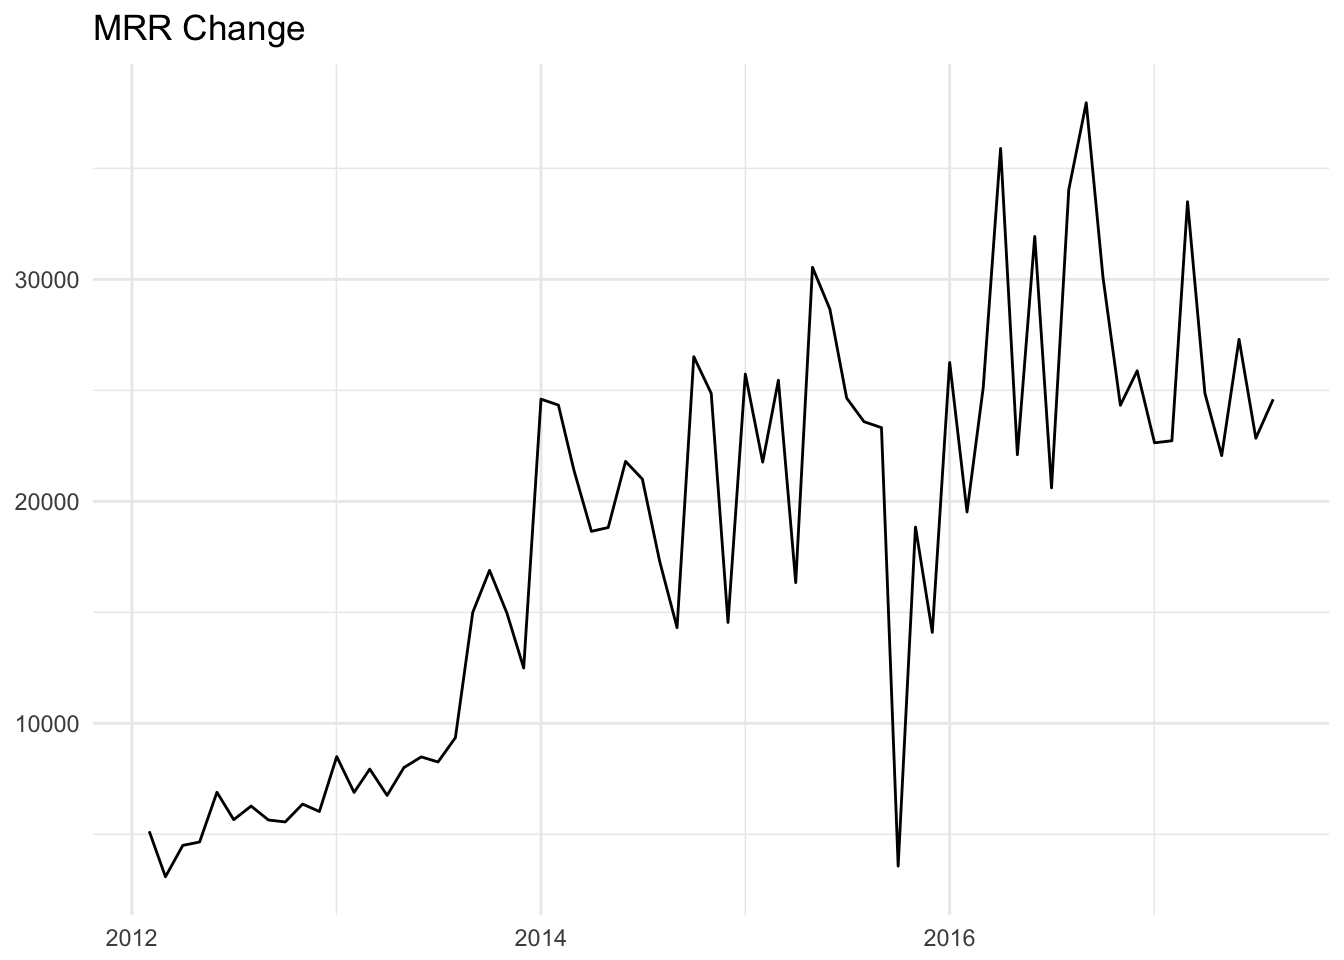
From looking at this graph, we suspect that there are multiple changes in MRR growth that have occurred over Buffer’s lifetime. In the next section we will use the changepoint package to identify if there indeed were significant changes in the average MRR growth of certain time periods, and, if so, where they occurred.
Changepoint detection
We can use the changepoint R package to identify shifts in the mean and variance of time series like ours. We will use the binary segmentation algorithm to detect changepoints in our dataset.
Binary segmentation works by applying single changepoint test statistic to the entire data. If a changepoint is identified, the data is split at the location of the changepoint. The single changepoint procedure is repeated on the two new data sets, before and after the change. If changepoints are identified in either of the new datasets, they are split further. This process continues until no changepoints are found in any parts of the data.
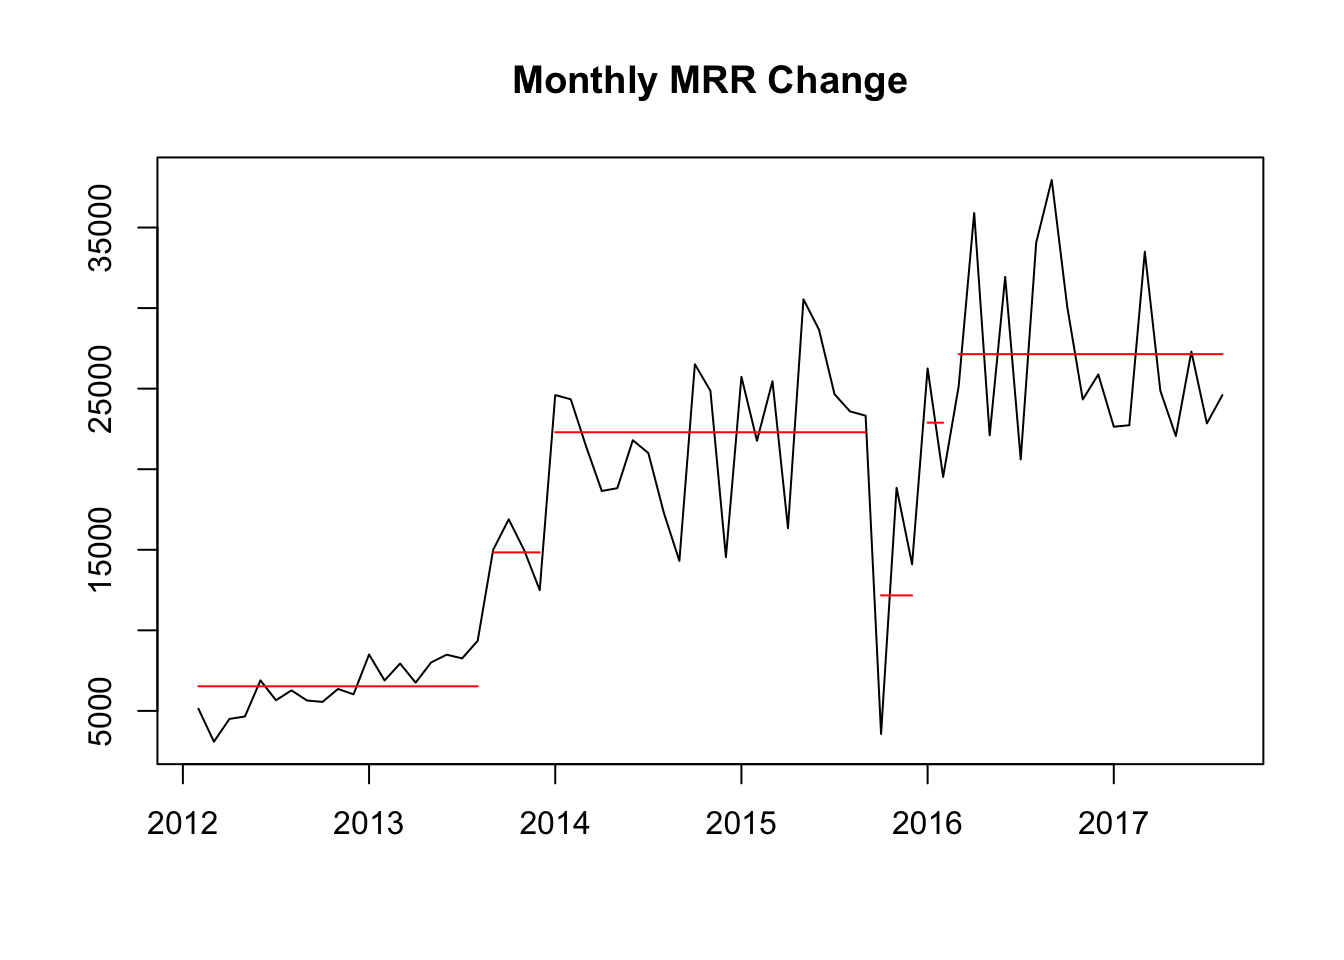
The algorithm detects 5 changepoints in monthly MRR growth. The changepoints occur at August 2013, December 2013, September 2015, December 2015, and February 2016. I will try to recall significant events that occurred around these dates.
From January 2012 to August 2013, Buffer was growing by increasing amounts each month. This type of growth could be considered exponential.
Buffer for Business was launched in December of 2013. This lead to a large upwards shift in monthly MRR growth that lasted until September 2015.
In September 2015 we lengthened the Business trial length from 7 to 30 days. This lead to us having a period in which no Business trials were ending and a decrease in MRR growth for the months of September and October.
In December 2015, the deferred revenue from users that would have converted 7-day trials started to be collected and MRR recovered.
In February and March 2016, we experimented with pricing and doubled the price of Business plans, which lead to a slight increase in monthly MRR growth.
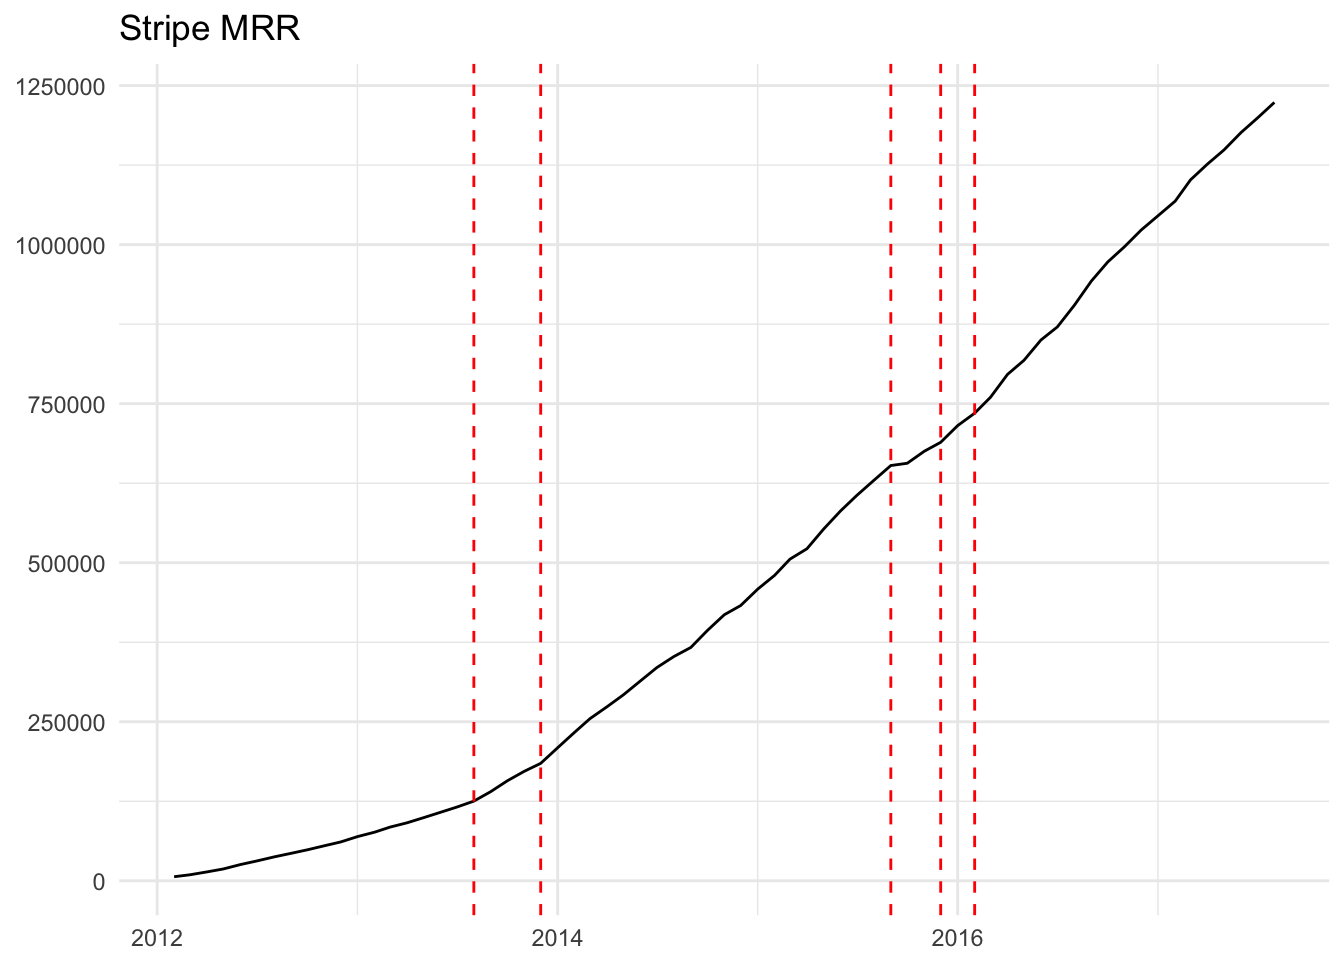
We can visualize these changepoints on the original graph of overall MRR.
Conclusions
Growth hasn’t always been linear. Buffer experience exponential growth in the early days, which was augmented by the launch of Buffer for Business in August 2013. From that point until September 2015, MRR growth was roughly linear on average.
In September 2015, we increased the length of Buffer for Business trials from 7 to 30 days. This had the effect of delaying MRR gained from Business trials by three weeks. We had a period in which no Business trials were ending and a decrease in MRR growth for the months of September and October was the result.
When the 30-day trials began finishing and converting again, MRR growth recovered to the level it was before the change in trial length.
In March of 2016, we doubled the price of Business plans, which lead to an upwards shift in monthly MRR growth. From that point on, we have experienced growth that is roughly linear on average.