People often ask what type of post gets the most reach on Facebook. It’s evident that videos have become more prevalent on Facebook in the past couple of years, but is the increase in reach worth the time and effort it takes to create video content?
In this analysis, we’ll try to answer that question within the narrow scope of Buffer’s Facebook posts. We’ll analyze all of the posts published to Buffer’s Facebook Page in 2017 and estimate the effect that the type of post has on reach.
Data collection
The data we use in this analysis comes from Facebook’s page insights. We exported three CSVs containing all of the “posts” data for posts published in 2017. We need to download three separate CSVs because it is only possible to download data for 180 days at a time. We’ll read the data into this R session using the code below.
# list filenames
file_list = c("~/Downloads/fb_posts1.csv", "~/Downloads/fb_posts2.csv", "~/Downloads/fb_posts3.csv")

# first apply read.csv, keeping the first 13 columns then rbind
posts = do.call(rbind, lapply(file_list, function(x) read.csv(x, header = F, stringsAsFactors = F, skip = 2)[, 1:14]))
Great. Now that we have all of the data in a single dataframe, we’ll need to rename the columns.
# list column names
names <- c('id', 'link', 'text', 'type', 'countries', 'languages',
           'posted_at', 'audience', 'total_reach', 'organic_reach',
           'paid_reach', 'total_impressions', 'organic_impressions', 'paid_impressions')

# rename columns in dataframe
colnames(posts) <- names
Now let’s set the posted_at column to a date type and extract some new columns from it. We create the columns posted_hour and day_of_year using the lubridate package.
# set posted_at as date type
posts$posted_date <- as.Date(posts$posted_at, format = "%m/%d/%Y")

# get the hour of day, day of month, day of year
posts <- posts %>%
  mutate(day_of_year = yday(posted_date))
Great, now we’re ready to do some exploratory analysis.
Exploratory analysis
The metric that we’re most interested in is organic_reach. Let’s visualize the distribution of this metric for all posts in 2017.
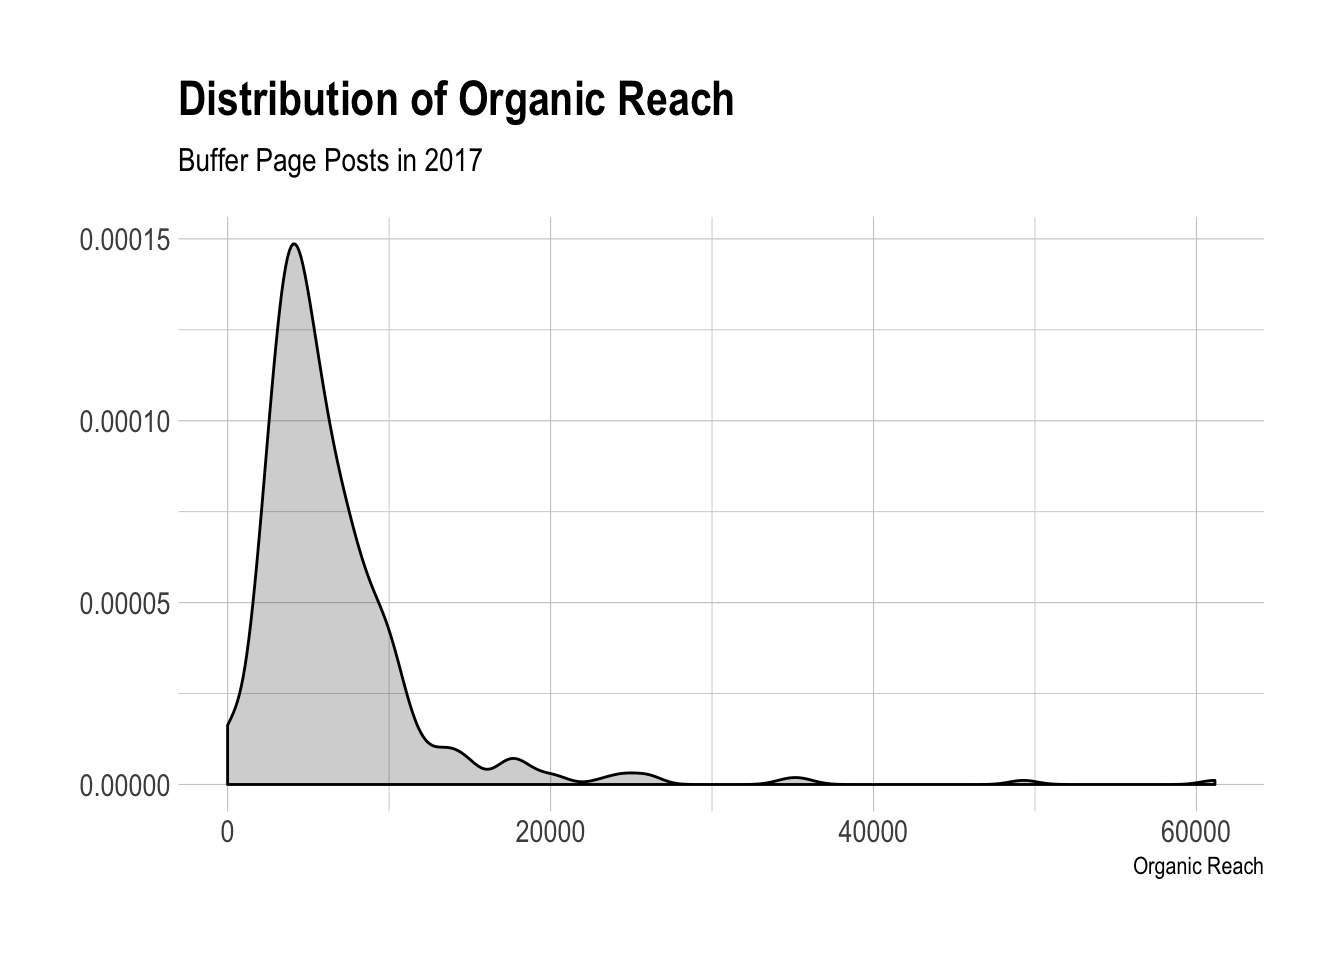
We can see that the distribution is centered somewhere around 5200, with a long tail reaching all the way out to 60,000. We can see how the organic reach changed over the course of the year by plotting the values against time.
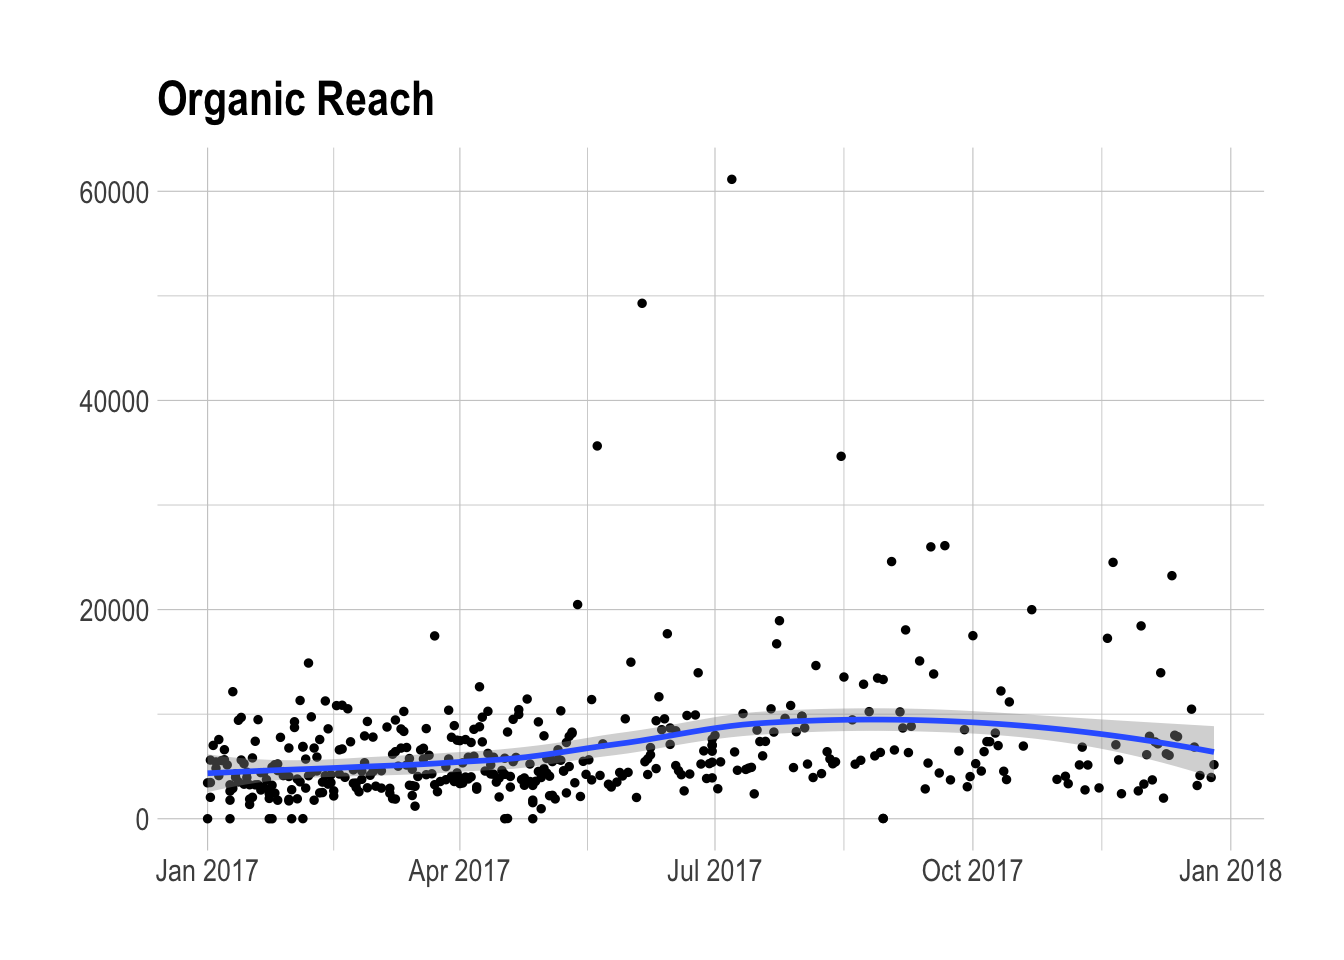
In this scatter plot, each point represents a post. We can see there there are a few outliers that had an organic reach of over 30,000! The overall trend shows an increase in organic reach until the end of the year, when it starts to decrease. Let’s label these points by the type of post that they were.
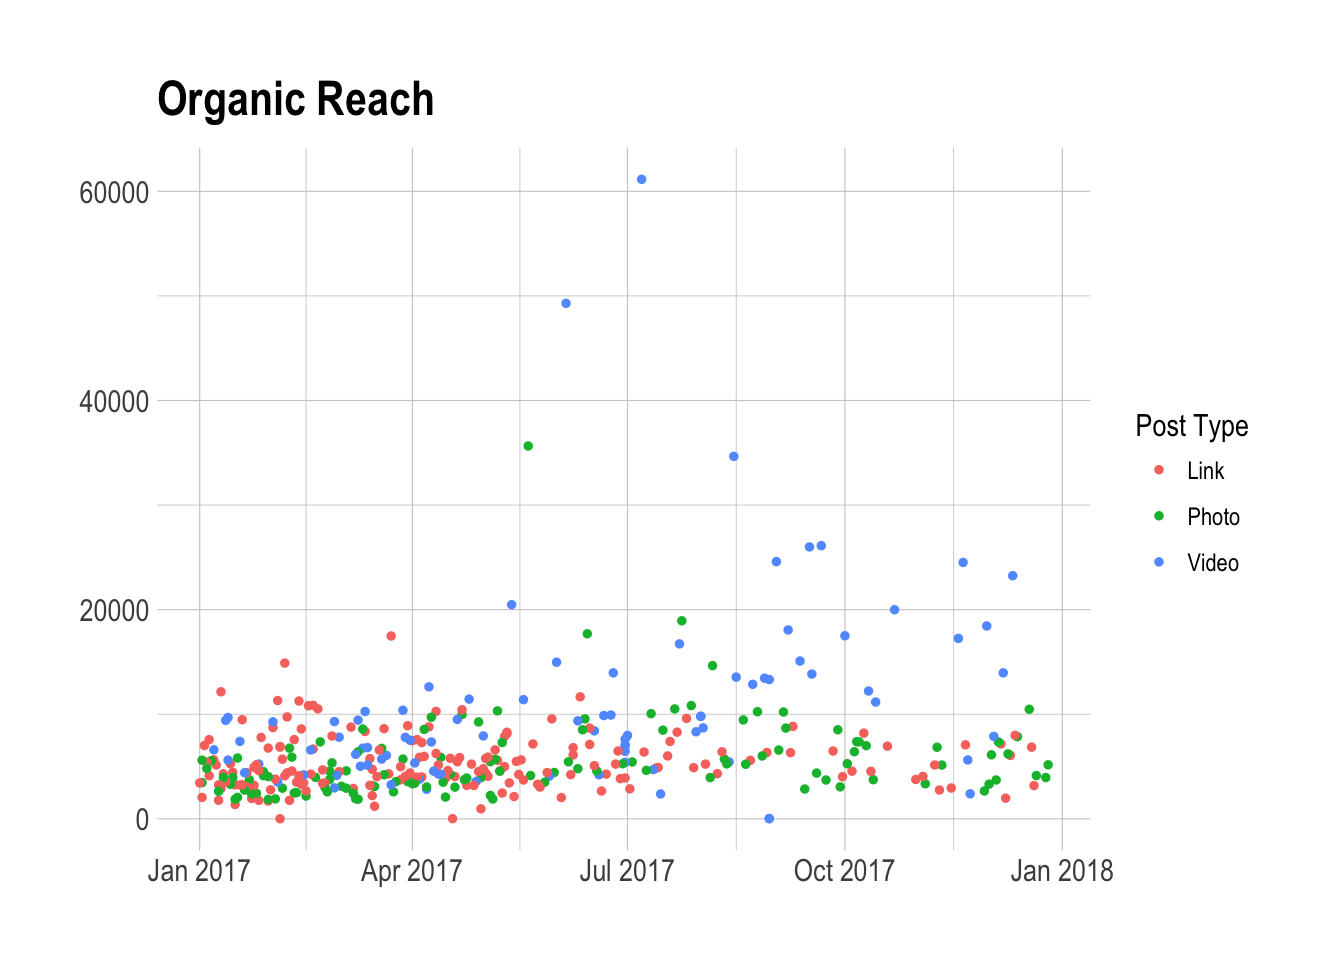
We can see here that many of the posts with the highest organic reach were indeed videos! Now let’s visualize the distribution of organic reach for each type of post.
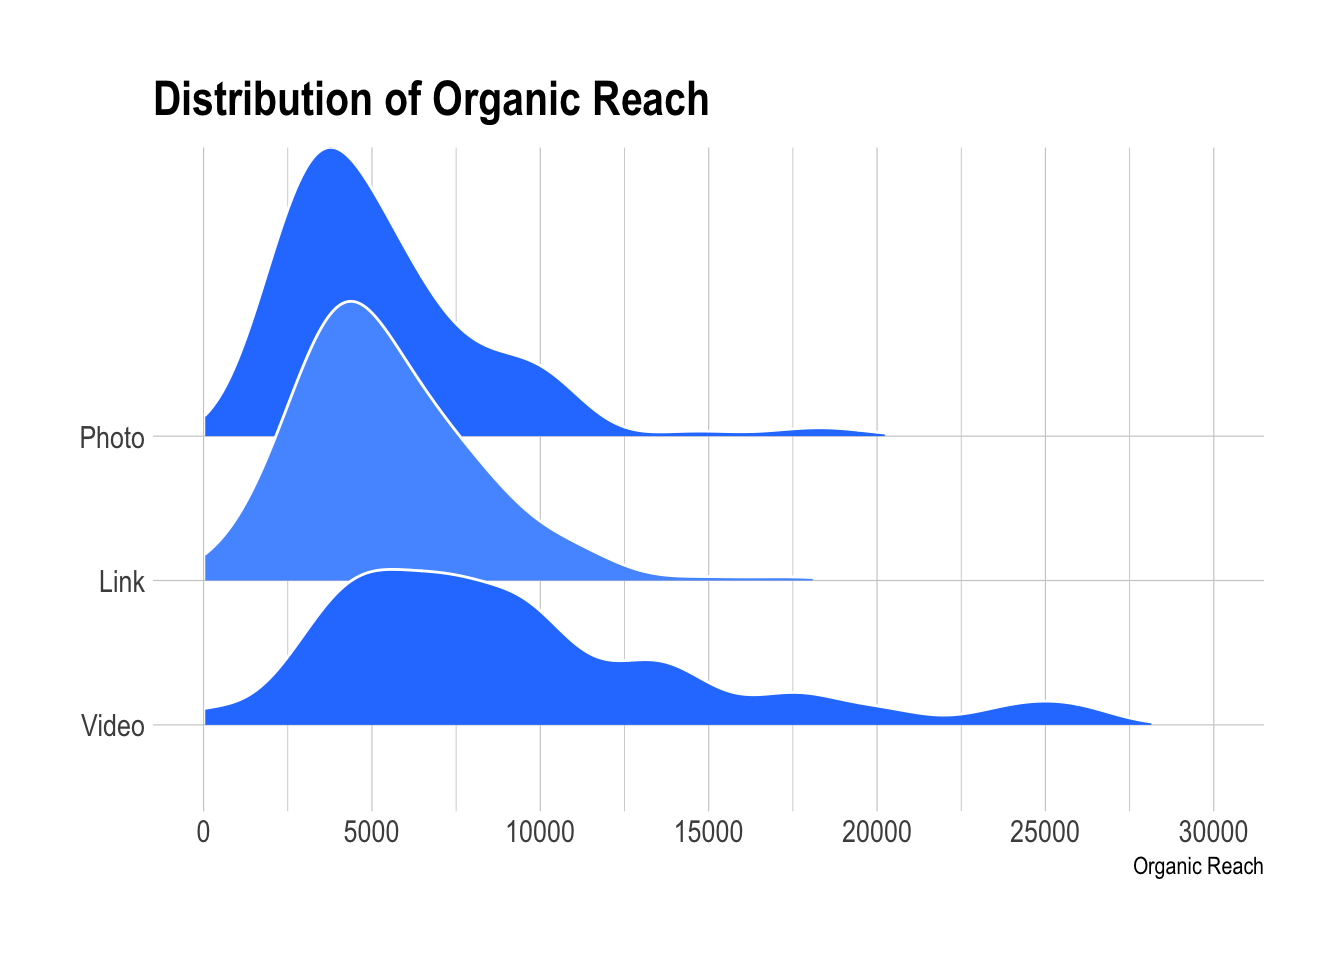
This plot shows us clearly that the distribution of organic reach is quite different for video posts than it is for photo and link posts. For one, it’s much wider, indicating that there is higher variance in organic reach for video posts. In addition, the center of the distribution is shifted to the right relative to Link and Photo posts, suggesting that video posts get more organic reach.
We can try to estimate the effect that the type of post has on organic reach by building a simple linear regression model.
Linear regression
Let’s fit a simple linear regression model to this data to try to estimate the effect that the type of post has on organic reach. We will try to control for the general increase in reach over time by including the variable day_of_year in the model.
# set type as factor and filter out types we aren't interested in
target_posts <- posts %>%
  filter(type %in% c("Link", "Photo", "Video")) %>%
  mutate(type = as.factor(type))

# fit linear regression model
lm_mod <- lm(organic_reach ~ day_of_year + type, data = target_posts)

# summarise model
summary(lm_mod)
##
## Call:
## lm(formula = organic_reach ~ day_of_year + type, data = target_posts)
##
## Residuals:
## Min 1Q Median 3Q Max
## -11662 -2281 -784 1252 50093
##
## Coefficients:
## Estimate Std. Error t value Pr(>|t|)
## (Intercept) 4099.204 494.878 8.283 1.92e-15 ***
## day_of_year 11.689 2.719 4.300 2.16e-05 ***
## typePhoto -200.849 609.124 -0.330 0.742
## typeVideo 4754.350 677.667 7.016 1.01e-11 ***
## ---
## Signif. codes: 0 '***' 0.001 '**' 0.01 '*' 0.05 '.' 0.1 ' ' 1
##
## Residual standard error: 5183 on 392 degrees of freedom
## Multiple R-squared: 0.1858, Adjusted R-squared: 0.1796
## F-statistic: 29.82 on 3 and 392 DF, p-value: < 2.2e-16The summary table tells us the estimate of the effect that video posts have on organic reach, relative to link posts. The estimated increase in organic reach is 4754, and the standard error of this coefficient (the average amount that the coefficient estimates vary from the actual average value) is around 677. This is quite a large effect!
We can use this model to make predictions for each post that depend on the day of year and type of post.
# add model predictions to original data frame
target_posts$predictions <- round(predict(lm_mod, newdata = target_posts), 0)

# add residuals to original data frame
target_posts <- target_posts %>%
  mutate(residuals = abs(organic_reach - predictions))
The linear regression model minimizes the sum of the absolute value of the difference between the predicted and observed values. Let’s visualize the differences between the actual and predicted values.
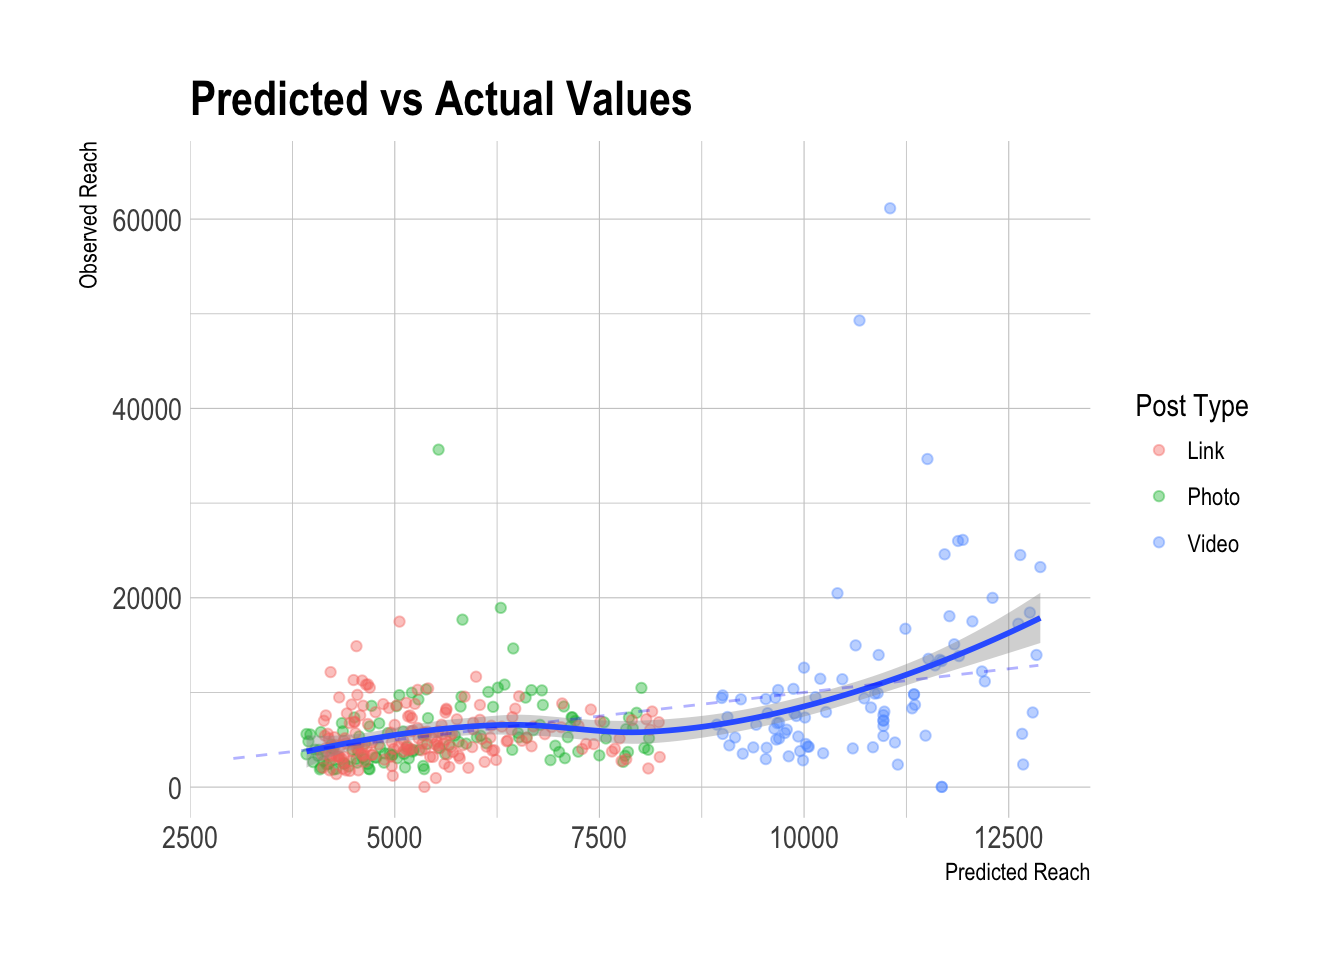
We can see here that the model does fairly well, which isn’t too surprising given that this is all training data. The dotted line is what we would be aiming for, the ideal relationship between predicted and actual values. The solid blue line with ribbons shows the average relation between the predicted and actual organic reach values.
There are clearly some posts on the outer edge of the distribution that appear as outliers here. We can see that many of them were videos. This makes sense, as there was much more variance in observed reach of video posts.
Conclusions
Video posts have generally had more ogranic reach than link and photo posts in the past year, but the relationship between the type of post and organic reach is not necessariliy linear. The type of content contained in the post is likely a confounding factor, as is the time of day. Given the large variance in organic reach, video posts may be more likely to be somewhat “viral”, whereas reach for link and photo posts are slightly more predictable.