Buffer is well known for its 10 core values that guide the company forward. Continuously thinking and acting on these values has benefited the company a great deal over the years and has made an important contibution to our financial and emotional health.
Every year, we ask team members to grade Buffer as an organization on how well it lives up to the values. In the survey, the responder is prompted to choose a value on a five-point scale for each of the ten values, with one corresponding to a value that needs a lot more work and five corresponding to a value that Buffer is strongly living. The respondents were also asked if there were any values that should be added to Buffer’s company values and if there were any values that should be removed from Buffer’s current values.
In this analysis, we’ll summarise the responses for each value and compare 2017’s responses to those of 2016.
Data collection
The responses were stored in two Google Sheet’s which I have downloaded, 2017_values_survey.csv and 2016_values_survey.csv. Let’s read those into our R session.
# read csv files
values17 <- read.csv('~/Downloads/2017_values_survey.csv')
values16 <- read.csv('~/Downloads/2016_values_survey.csv')
Next we’ll do a bit of tidying. We’ll need to select the right columns and clean up the column names.
# function to capitalize first letter
capitalize <- function(value_string) {

   substr(value_string, 1, 1) <- toupper(substr(value_string, 1, 1))

   return(value_string)
}

# function to clean data
clean_df <- function(df) {

  # only select 10 columns
  df <- df[, 2:11]

  # clean column names
  colnames(df) <- c('choose_positivity', 'default_to_transparency',
                    'focus_on_self_improvement', 'be_no_ego_doer',
                    'listen_first', 'communicate_with_clarity', 'make_time_to_reflect',
                    'live_smarter', 'show_gratitude', 'do_the_right_thing')

  # create well written value column
  df <- df %>%
    gather(value, score, choose_positivity:do_the_right_thing) %>%
    mutate(good_value = capitalize(gsub("_", " ", value)))

  return(df)
}

# clean data frames
values17 <- clean_df(values17)
values16 <- clean_df(values16)
Awesome! Now we’re ready to summarise the responses from this year’s survey.
2017 results
We can average the scores for each value to summarise the sentiment from the team. Although not every distribution of scores is normally distributed, the sample sizes are relatively large and the scores are constrained to a low number of values (1-5). We could plot the distribution of responses anyway, if anyone is interested in seeing that.
Without further ado, here are the values ranked by how well Buffer lives up to them.
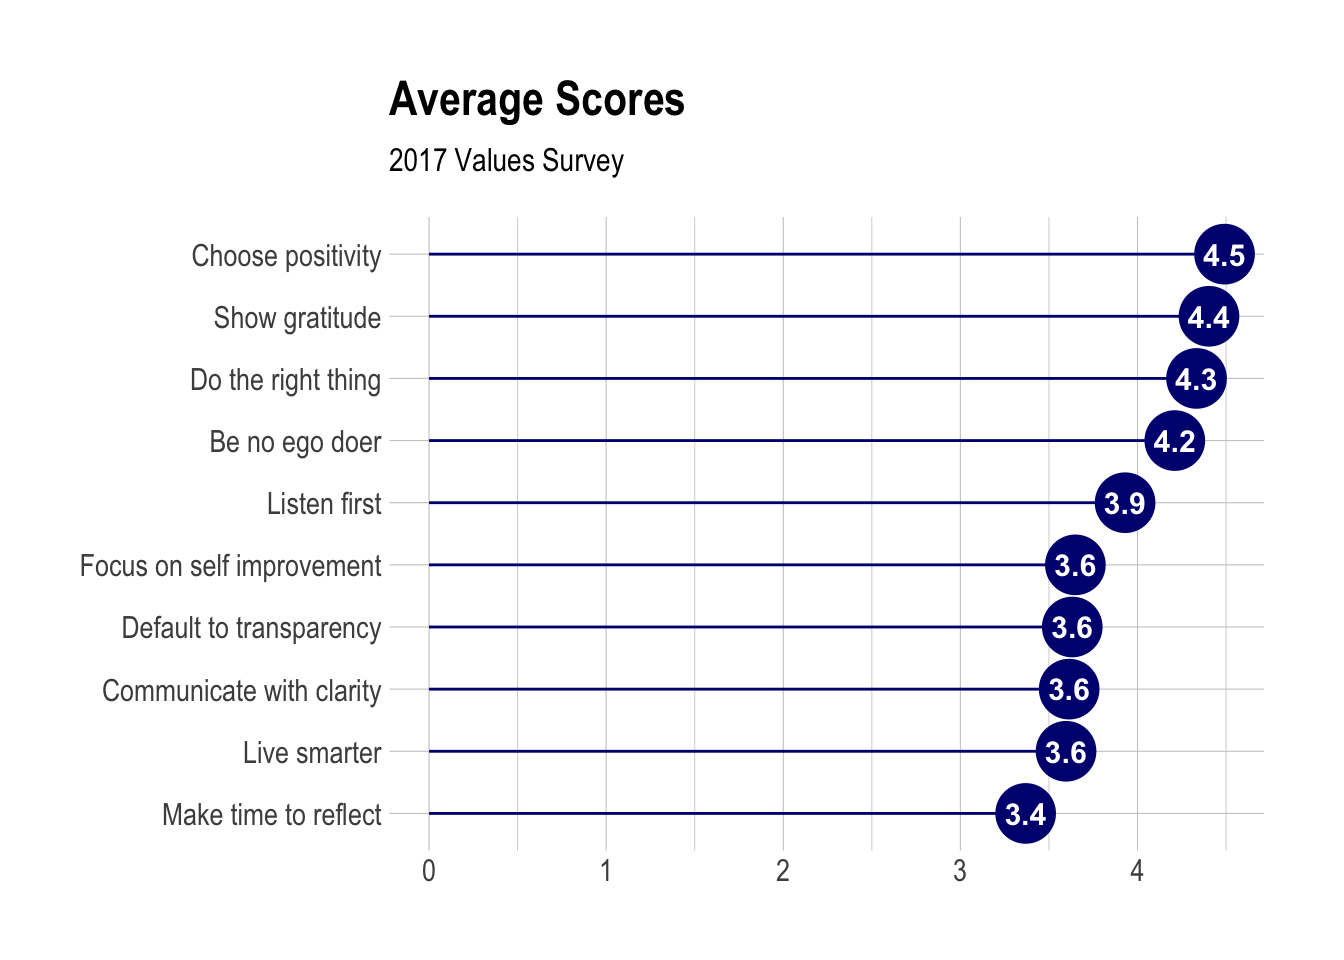
There are four values with an average score of 4.0 or higher: choose positivity, show gratitude, do the right thing, and be a no ego doer. This is a great accomplishment and reflects well on Buffer as a selfless, optimistic organization.
Five values had an average score between 3.9 and 3.5: listen first, then listen more, focus on self improvement, default to transparency, communicate with clarity, and live smarter, not harder. These values may be more difficult to live up to in practice in a fully remote and distributed team. It’s good to know that we have room to grow in these areas.
Finally, “Make time to reflect” has an average score of 3.4. This value is similar in a way to “Live smarter, not harder”, and can be difficult to live by for an ambitious organization with limited resources.
Let’s compare these scores to the responses from last year’s survey.
Comparing 2017 and 2016
In order to do this effectively, we’ll need to combine the dataframes including the responses from 2016 and 2017.
# specify years
values17$year <- 2017
values16$year <- 2016

# bind data frames
responses <- values17 %>%
  bind_rows(values16)
Now let’s plot the changes in the average scores from 2016 to 2017.
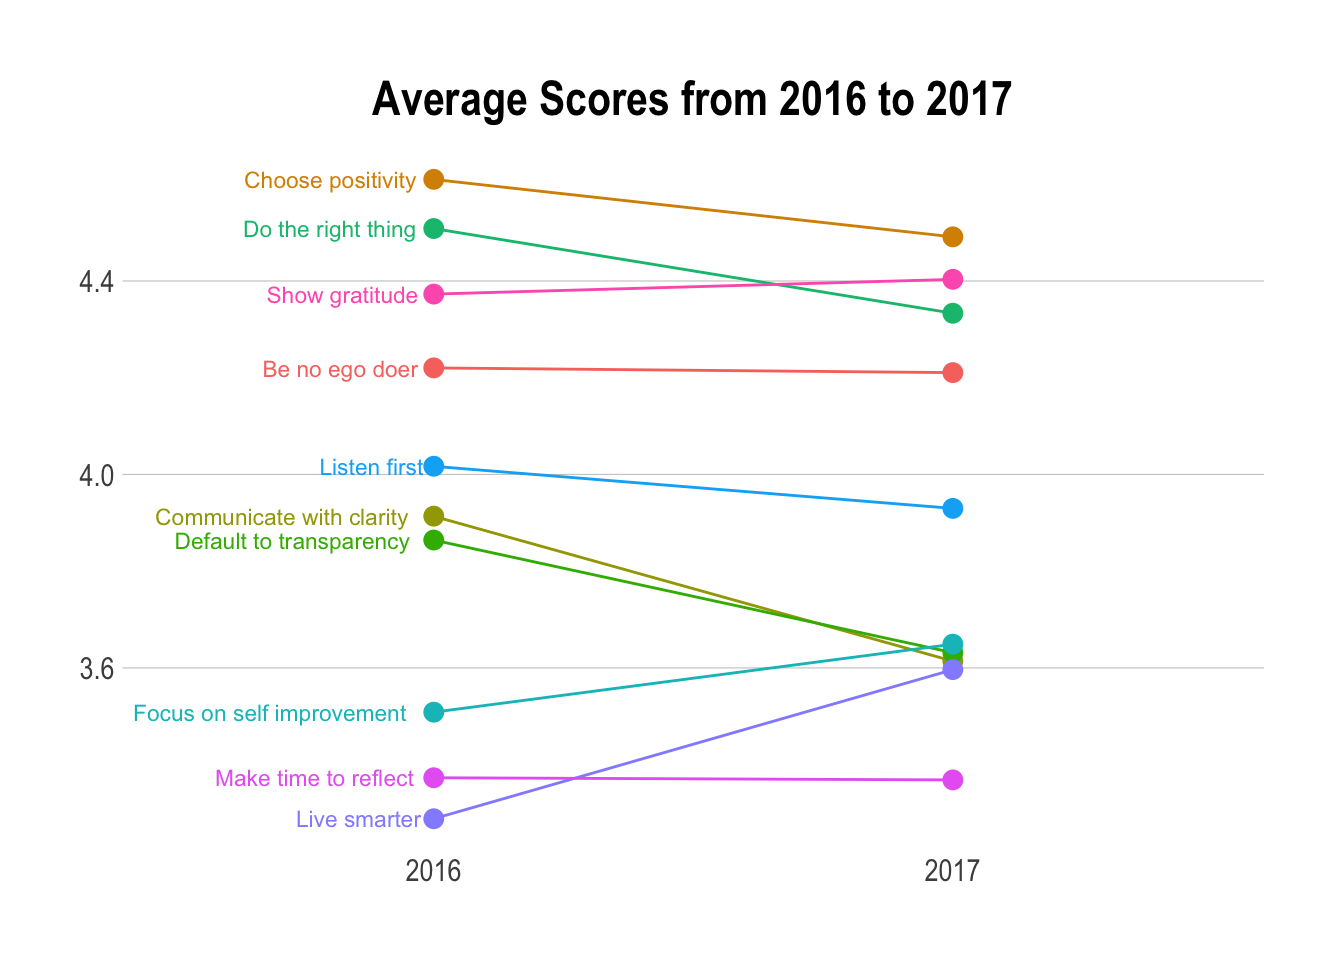
A few things stand out in this plot. First, we can see that there is a slightly narrower range of the scores. The highest (average) score is lower in 2017 than the highest score in 2016, and the lowest score is higher than that of 2016. The global average, the overall average of all scores, decreased slightly from 3.97 in 2016 to 3.92 in 2017.
Choose positivity, do the right thing, show gratitude, and be a no ego doer were the highest scoring values again. The value “do the right thing” had a significantly lower average score and was “overtaken” by the “show gratitude” value, which had a higher average score in 2017.
Interestingly, two values had particularly lower average scores in 2017. These are “communicate with clarity” and “default to transparency”. The “focus on self improvement” and “live smarter, not harder” values had significantly higher average scores in 2017 and ended up with similar scores to “communicate with clarity” and “default to transparency”.
That’s it for now! Let me know if you have any questions or feedback for me. :)