I recently came across another useful package from Mike Kearney called textfeatures. It’s a simple package for extracting useful features from character objects, like the number of hashtags, mentions, urls, capital letters, exclamation points, etc.
In this analysis we’ll analyze tweets from Buffer for Business users, and see which features correlate most closely to engagement. First let’s load the libraries we’ll need.
# load libraries
library(buffer)
library(dplyr)
library(tidyr)
library(ggplot2)
library(hrbrthemes)
library(ggridges)
library(textfeatures)
library(corrplot)
We now need to gather tweets sent from Buffer for Business users in the past few weeks. We’ll use the following query to do that.
with business_users as (
  select
    user_id
  from dbt.users
  where simplified_billing_plan = 'business'
)
select
  up.id
  , up.user_id
  , up.via
  , up.client_type
  , up.text
  , up.has_photo
  , up.has_multiple_photos
  , up.number_of_likes
  , up.number_of_favorites
  , up.number_of_times_mentioned
  , up.number_of_retweets
  , up.number_of_clicks
  , up.number_of_comments
  , up.number_of_total_interactions
from dbt.updates as up
inner join business_users as u
on up.user_id = u.user_id
where was_sent_with_buffer
and profile_service = 'twitter'
and up.created_at >= (current_date - 7)
and up.text is not null
and up.text != ''
and has_failed = false
# replace NAs with 0
tweets <- tweets %>%
replace_na(list(number_of_favorites = 0,
number_of_retweets = 0,
number_of_times_mentioned = 0,
number_of_total_interactions = 0))Now we can extract features from the text.
# extract text features
tweets <- tweets %>%
  bind_cols(textfeatures(tweets$text))
Cool! Now let’s create a correlation matrix with these features and the number_of_total_interactions field.
# extract features
features <- tweets %>%
  select(interactions:n_charsperword)

# build correlation plot
corrplot(cor(features), method = "color", type = "upper", tl.col = "black", tl.srt = 45)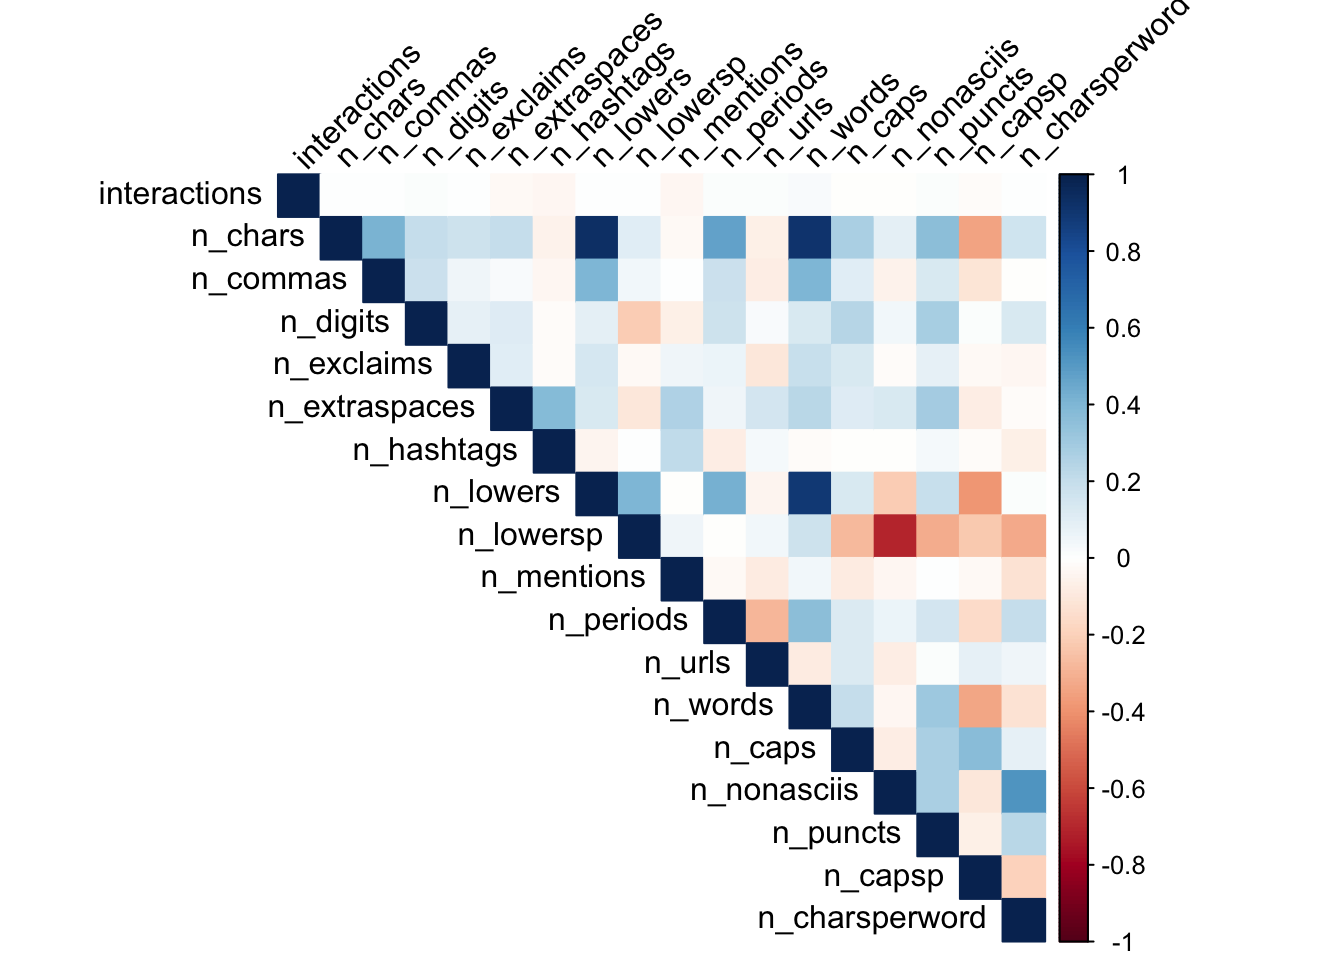
There doesn’t appear to be a strong correlation between interactions and any single feature. Just for fun, let’s plot the density function of interactions.
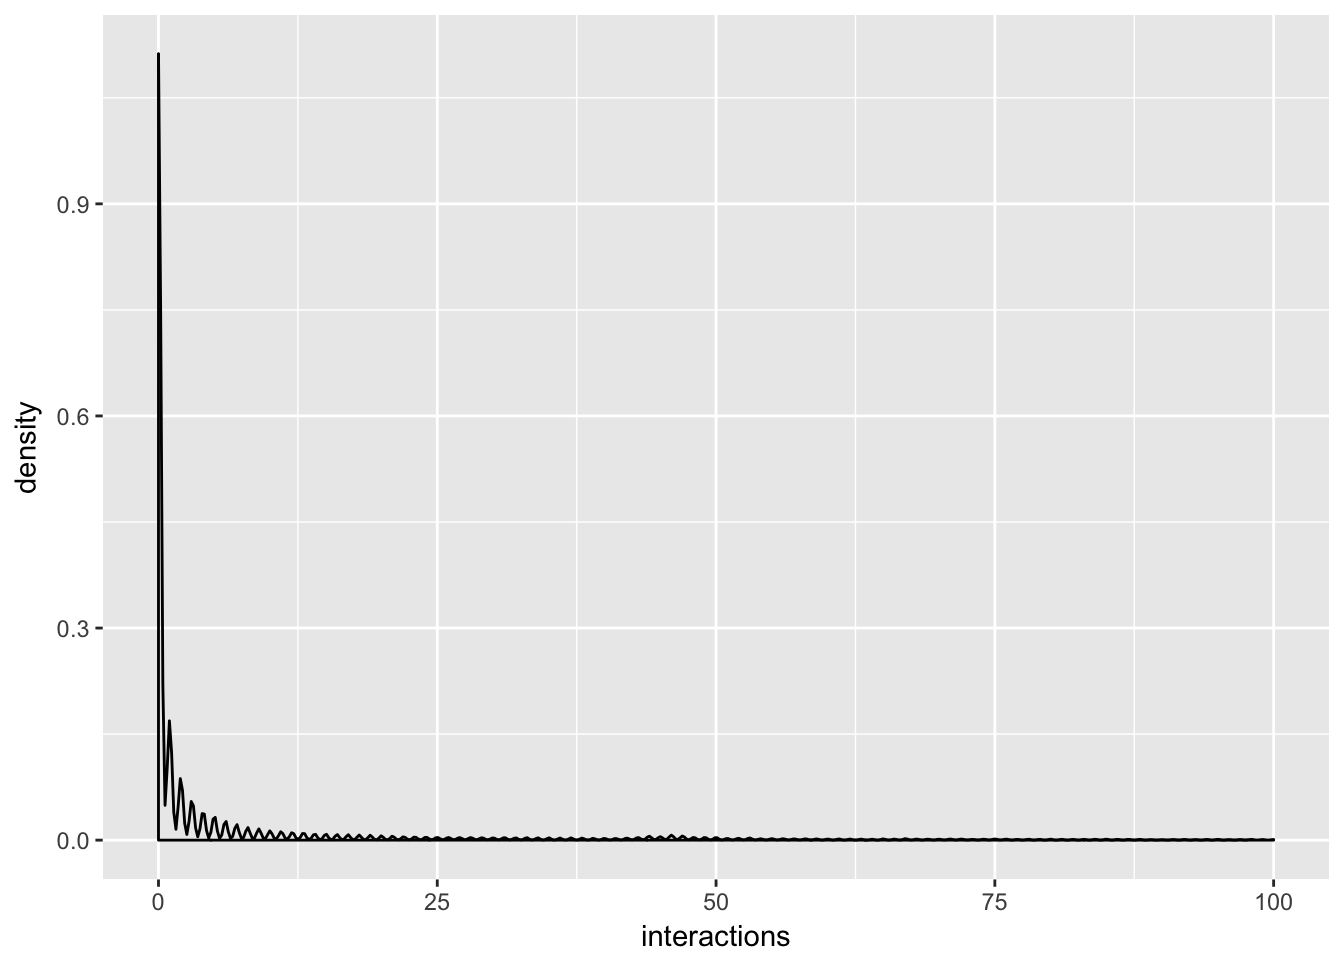
Looks to be power-law distributed. What if created the same correlation plot for a single user’s tweets?
# gather tweets of a single user
user_tweets <- tweets %>%
  filter(user_id == '56a511bd20e312680618e45d') %>%
  select(interactions:n_charsperword)

# build correlation plot for single user
corrplot(cor(user_tweets), method = "color", type = "upper", tl.col = "black", tl.srt = 45)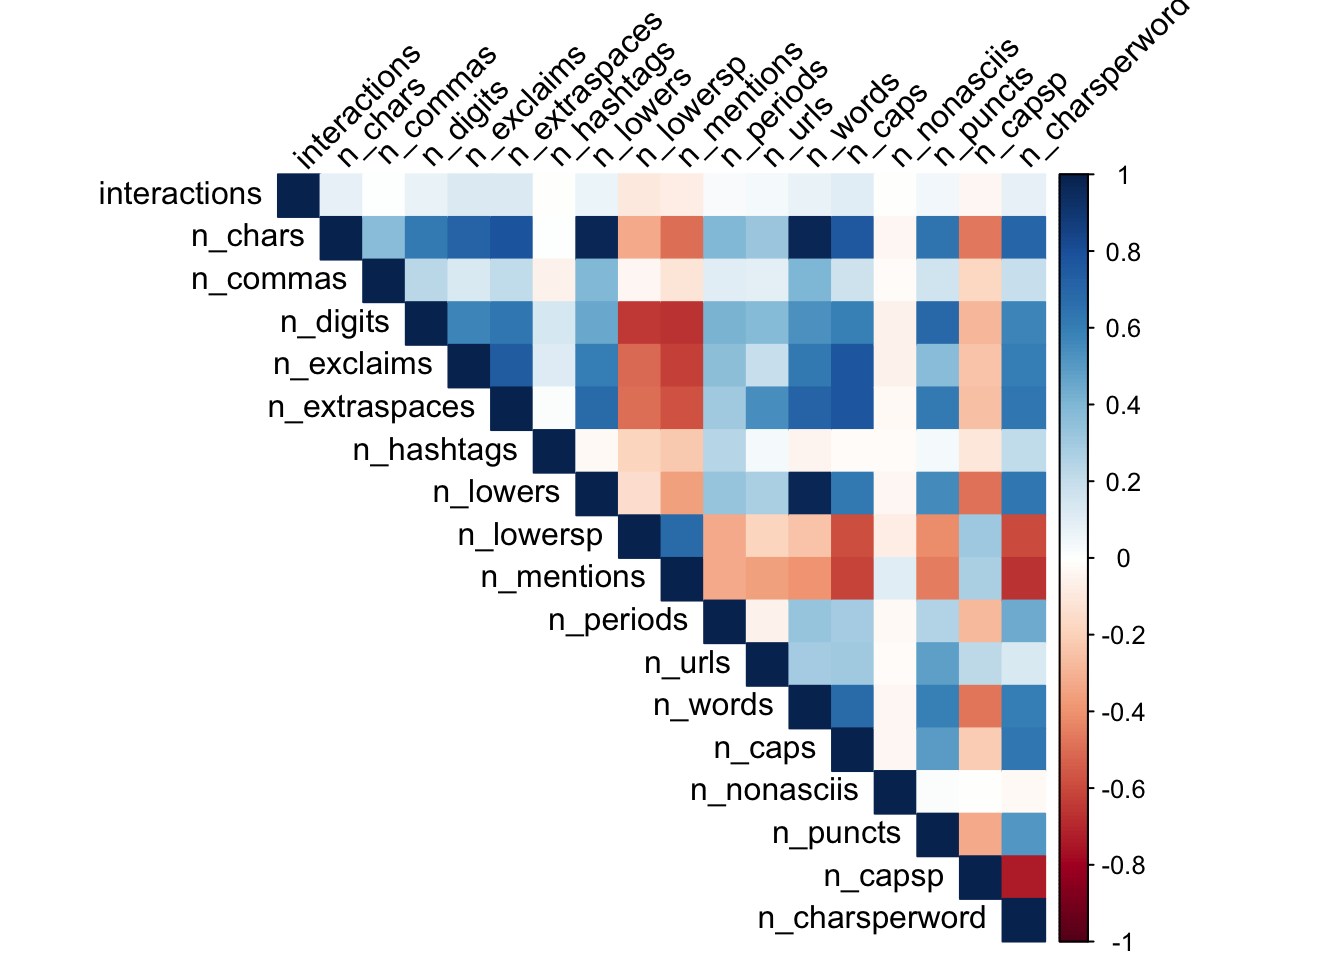
We can detect some stronger correlations here. Let’s plot the number of exclamation points against the number of interactions for this user’s tweets.
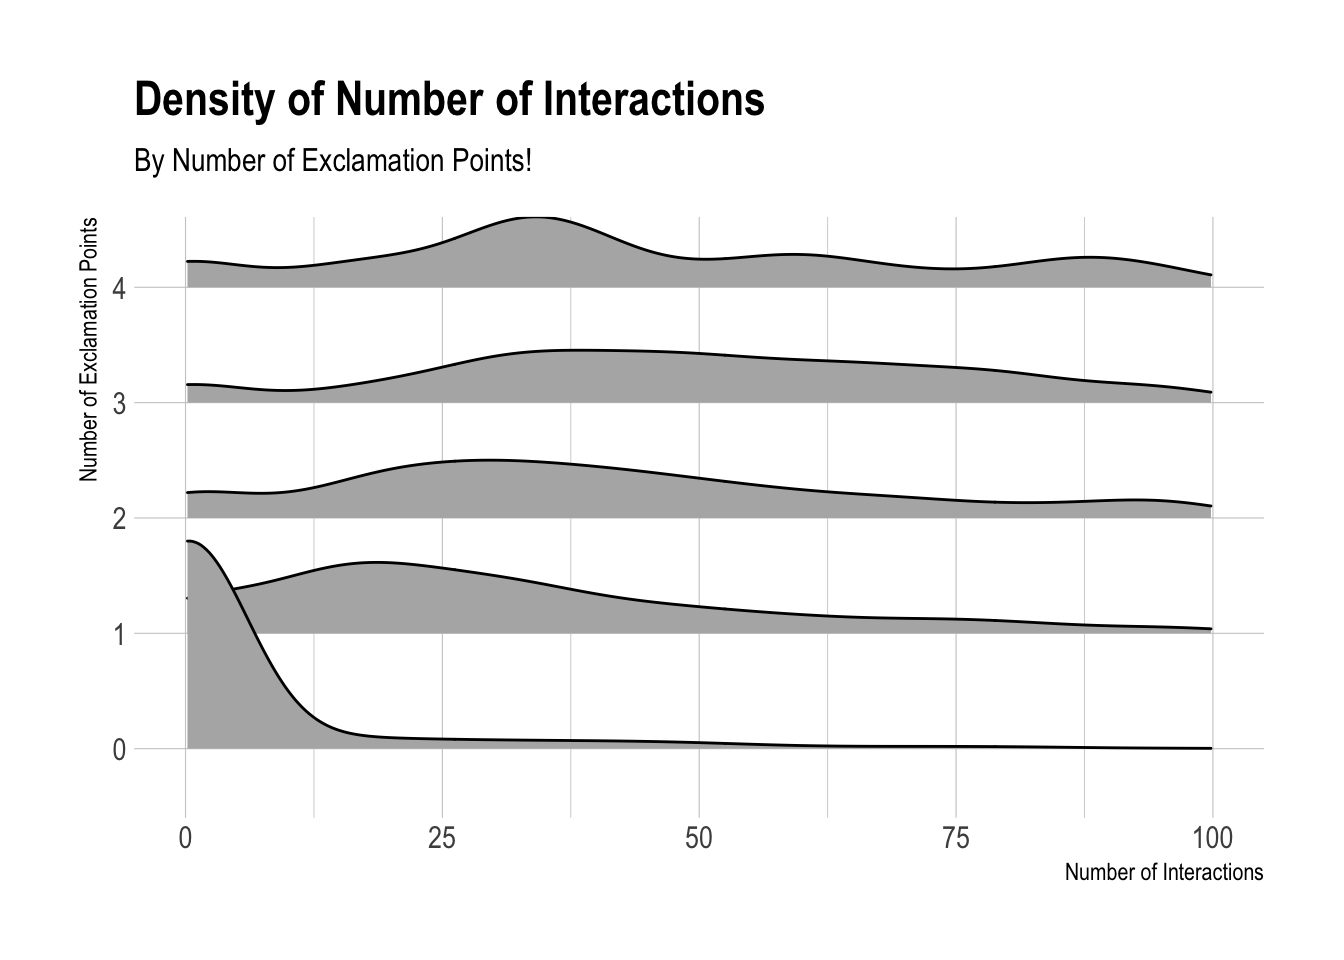
Not surprisingly, the distribution of interactions is quite wide. We could make some sort of log transformation to help this, but what if we plotted the median number of interactions for each number of exclamation points?
user_tweets %>%
  mutate(n_exclaims = as.factor(n_exclaims)) %>%
  group_by(n_exclaims) %>%
  summarise(tweets = n(), med_interactions = median(interactions)) %>%
  ggplot(aes(x = n_exclaims, y = med_interactions)) +
  geom_bar(stat = 'identity') +
  coord_flip() +
  theme_ipsum() +
  labs(x = "Median Number of Interactions", y = "Number of Exclamation Points",
       title = "Median Number of Interactions",
       subtitle = "By Number of Exclamation Points")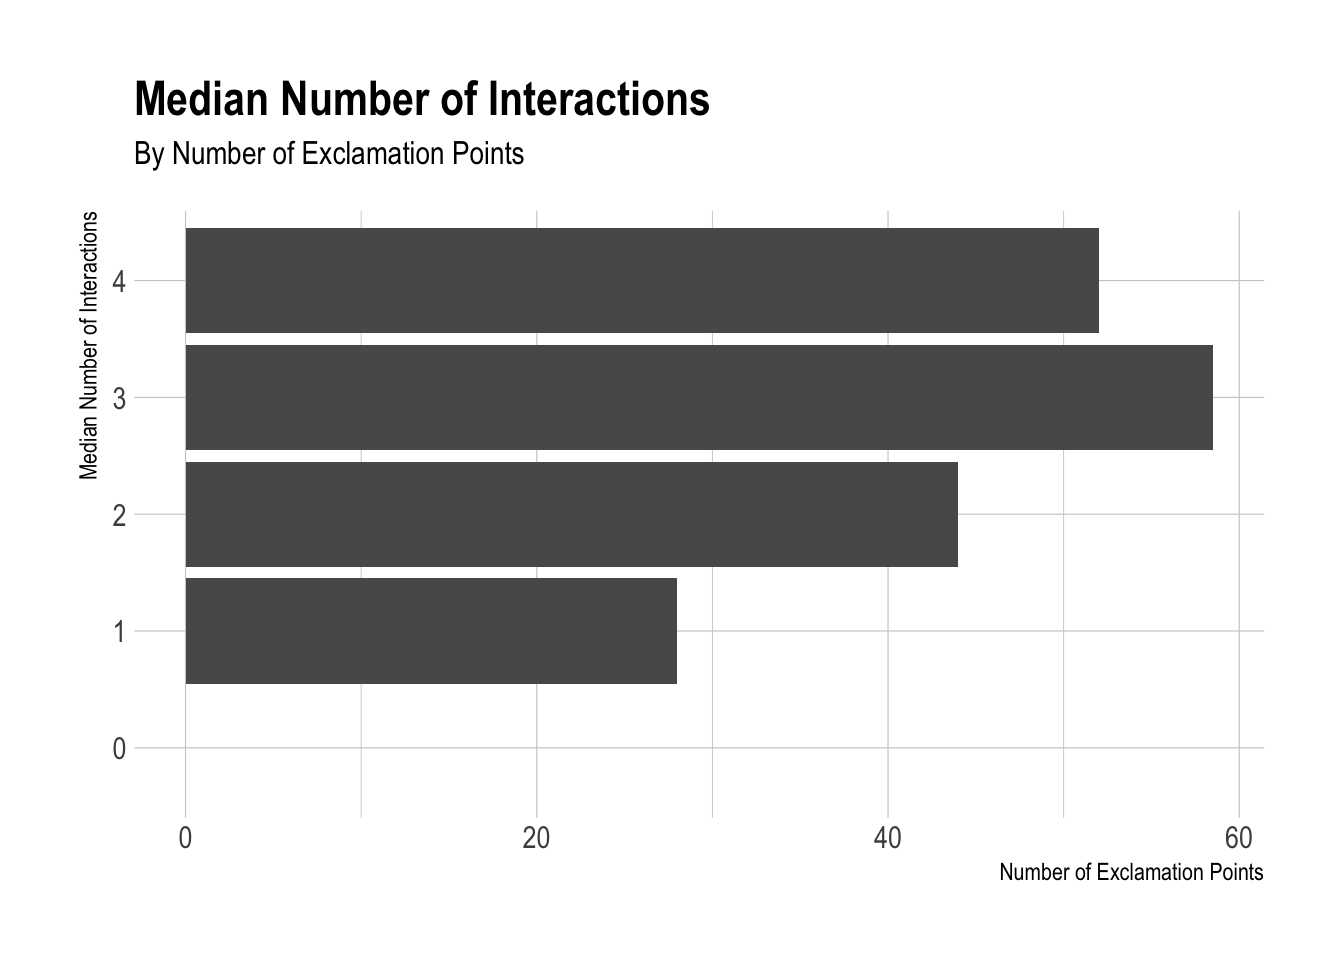
This is quite interesting to see. There appears to be a significant increase in the number of interactions that this user’s tweets get when there are more exclamation points. Let’s recreate this plot, but use the number of hashtags instead of the number of exclamation points.
user_tweets %>%
  mutate(n_hashtags = as.factor(n_hashtags)) %>%
  group_by(n_hashtags) %>%
  summarise(tweets = n(), med_interactions = median(interactions)) %>%
  ggplot(aes(x = n_hashtags, y = med_interactions)) +
  geom_bar(stat = 'identity') +
  coord_flip() +
  theme_ipsum() +
  labs(x = "Median Number of Interactions", y = "Number of Hashtags",
       title = "Median Number of Interactions",
       subtitle = "By Number of Hashtags")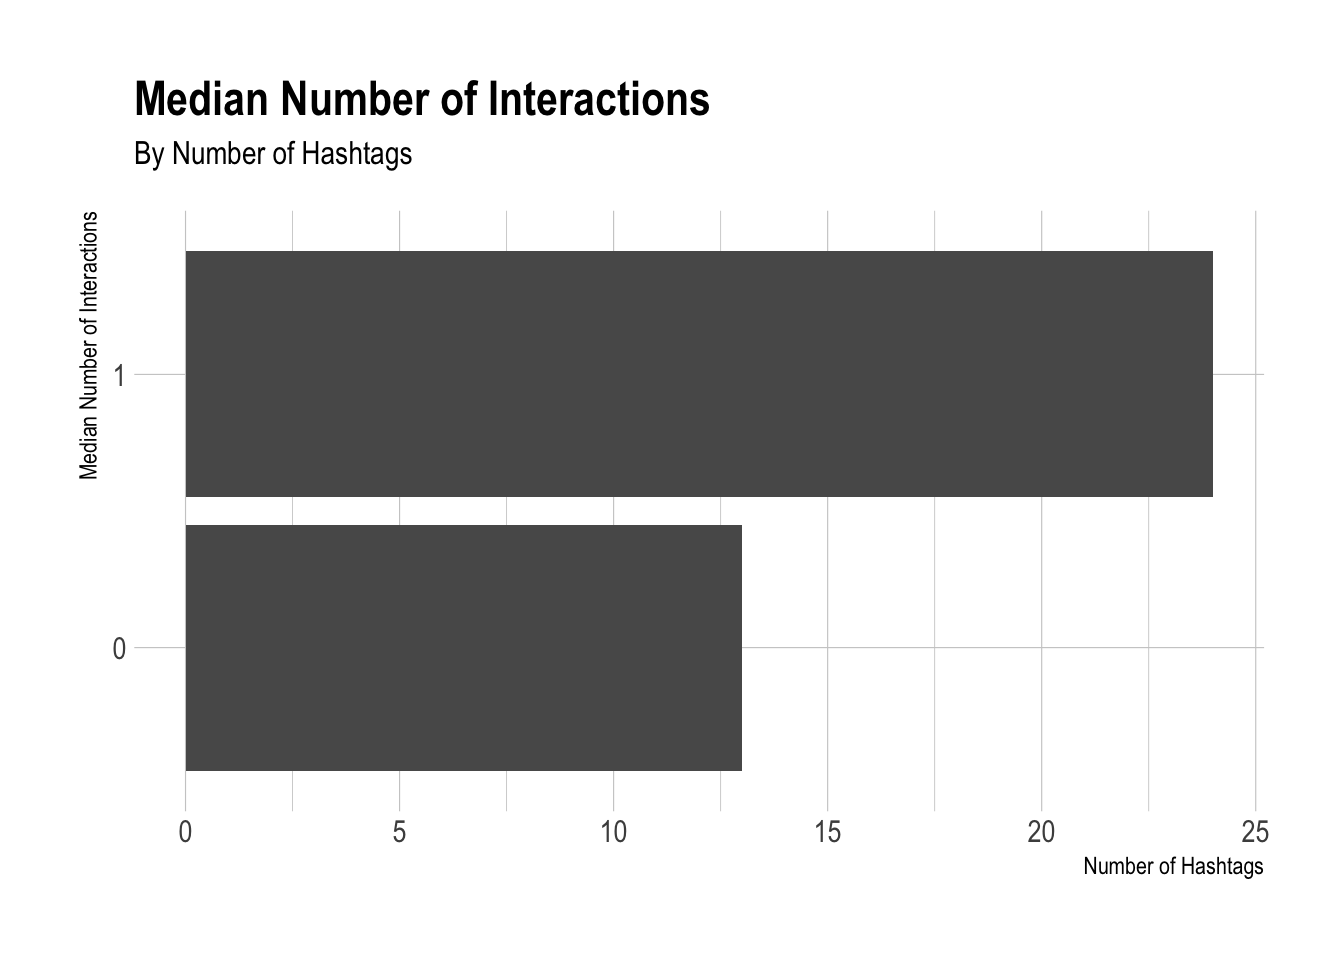
Cool! We’ll come back to this in the future…