I was inspired by this analysis done by the folks of Looker, which looks at the amount of screentime different characters get in the Game of Thrones series.
The dataset they used comes from data world and an imdb list. I’m grateful to the people that have collected and shared this data.
The dataset includes 191 named characters, the amount of screentime they have (in minutes), and the number of episodes they appear in. I manually entered the gender of the characters. I tried to be careful to look up the character if I was unsure of the gender, but I may have made some mistakes – please let me know if you spot any!
Data collection and tidying
Let’s read the csv file into R.
# Read csv
screentimes <- read.csv("~/Downloads/got_screentimes.csv", header = T)
Now we need to just do a tiny bit of tidying.
# Change episodes to numeric vector
screentimes$episodes <- as.numeric(as.character(screentimes$episodes))
## Warning: NAs introduced by coercionThere are characters with unspecified set as the value in episodes. We can probably estimate the number of episodes these characters appear in, based on the amount of screentime they’ve gotten. Let’s plot the relationship between screentime and episodes.
# Plot screentime and episodes
ggplot(screentimes) +
  geom_point(aes(x = episodes, y = screentime), position = 'jitter', alpha = 0.5, na.rm = TRUE) +
  stat_smooth(aes(x = episodes, y = screentime), method = 'loess', na.rm = TRUE)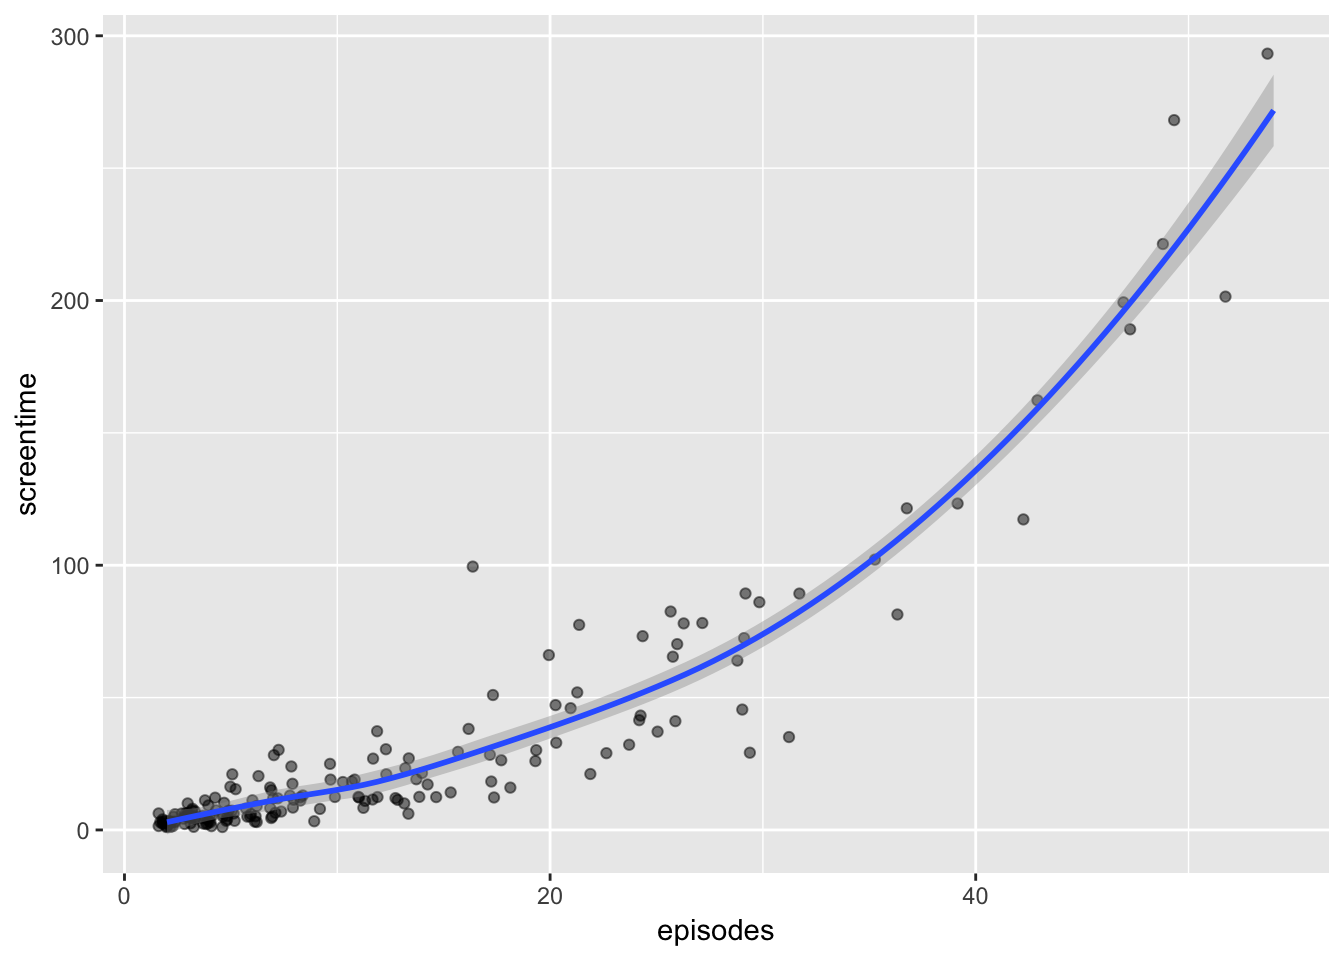
There is a clear positive relationship between the two that appears non-linear. We can therefore use the screentime variable as a predictor of episodes.
Let’s get the values of that smoother, which uses local regression, to estimate the episodes value.
# Get estimates for episodes
smooth_vals = predict(loess(episodes ~ screentime, data = screentimes), screentimes$screentime)

# Input in dataframe
screentimes$pred_episodes <- smooth_vals

# Replace NAs with the predictions
screentimes$episodes[is.na(screentimes$episodes)] <- screentimes$pred_episodes[is.na(screentimes$episodes)]
Great, we’re all set for some exploratory analysis!
Exploratory analysis
We’ll start by focusing on gender. How many characters of each gender are included in this dataset?
ggplot(screentimes) +
  geom_bar(aes(x = gender, fill = gender)) +
  labs(x = '', y = '', title = 'Number of Characters by Gender') +
  guides(fill = FALSE)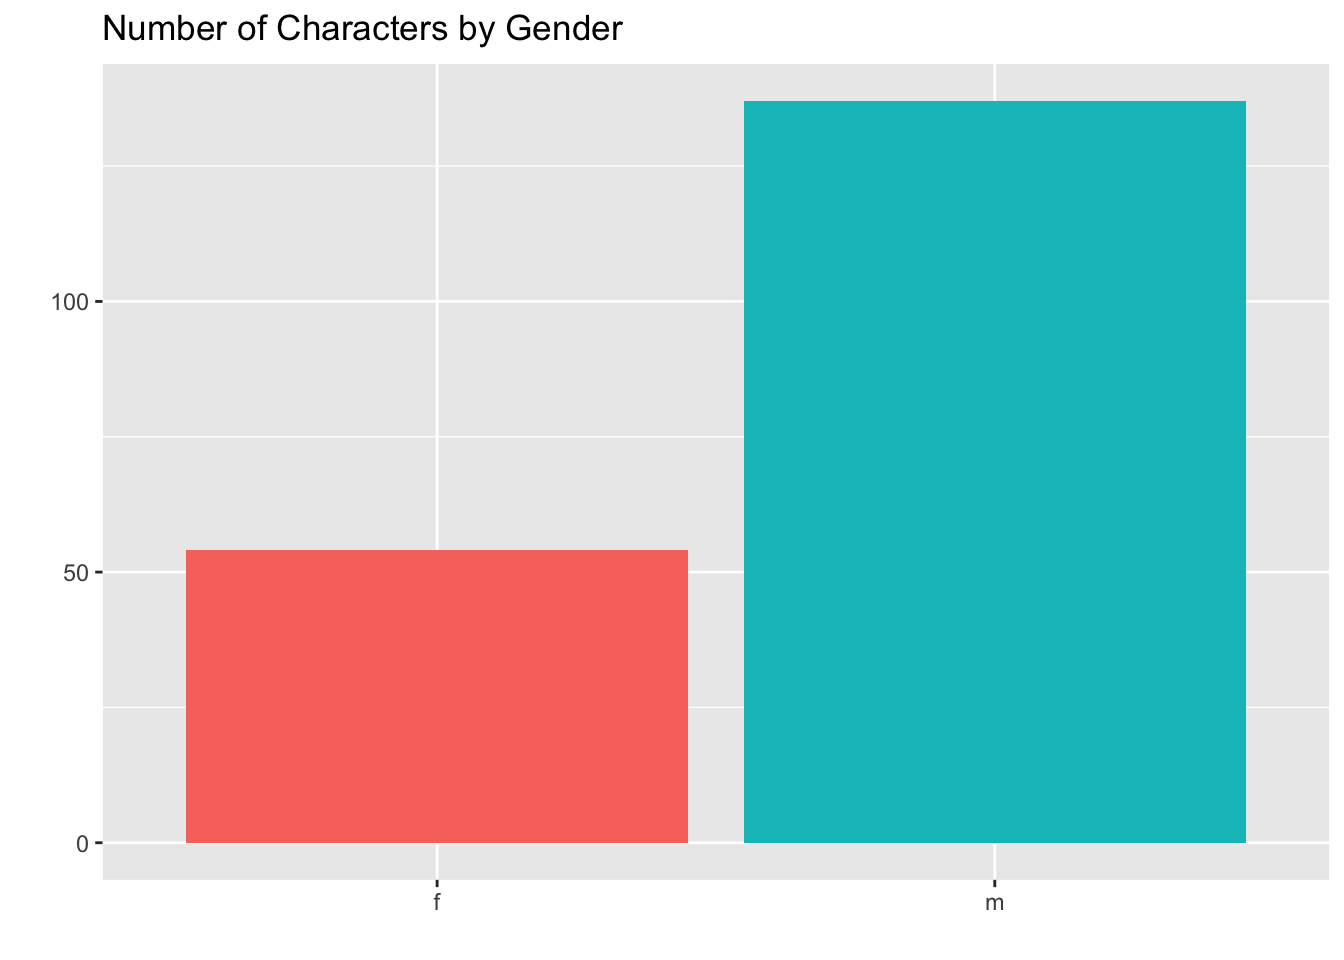
Wow, there are 137 men characters and only 54 women!
Total Screentime
We’ll start by looking at the top characters by screentime.
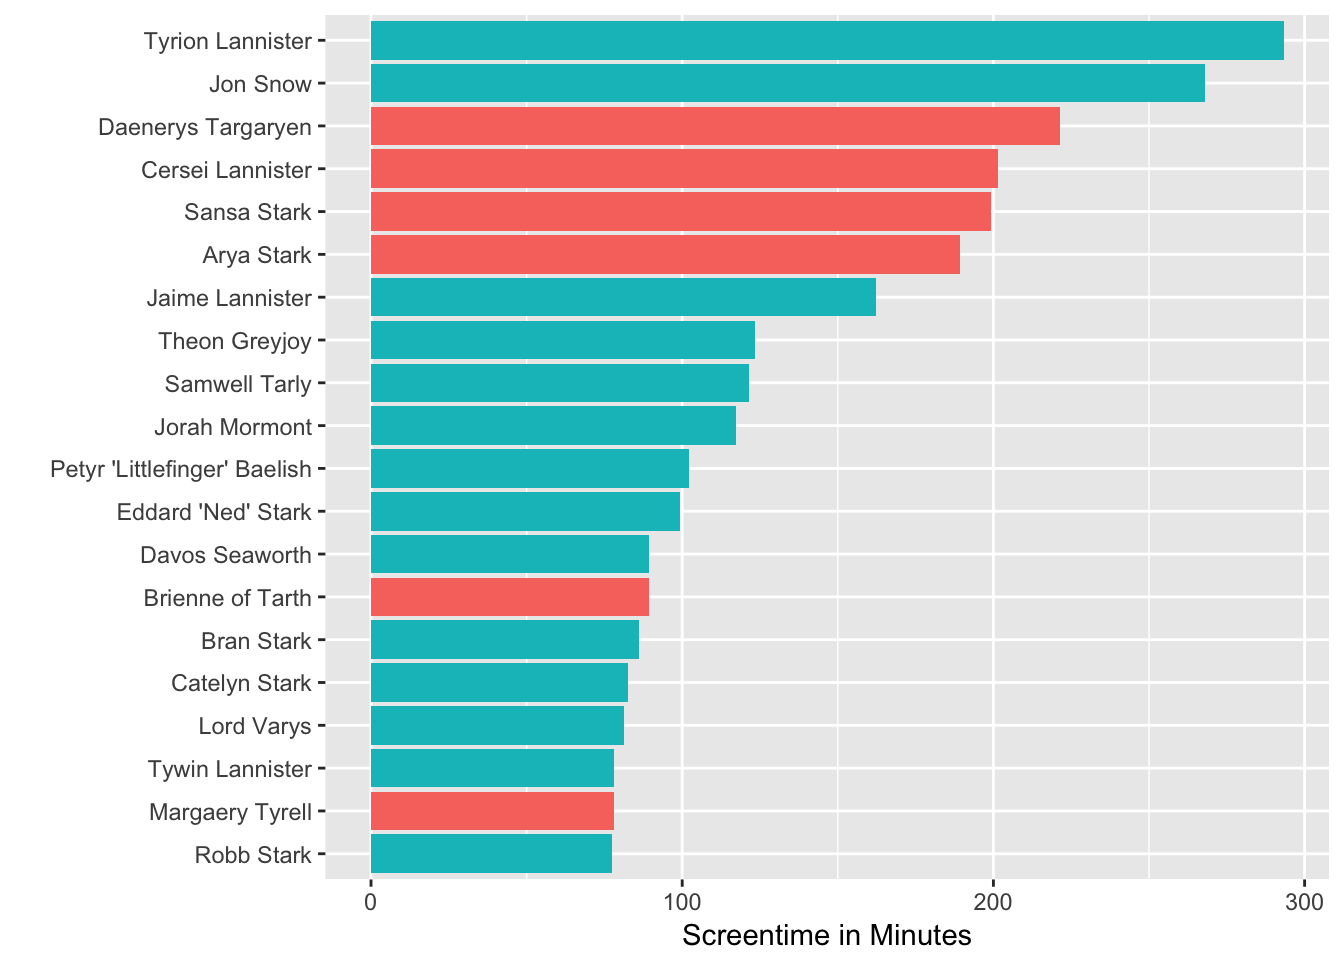
Tyrion has had the most screentime, which is awesome. He has more than 90 minutes more screentime than his sister Cersei. Let’s now see which characters have been in the most episodes – I supoose the graph will look similar.
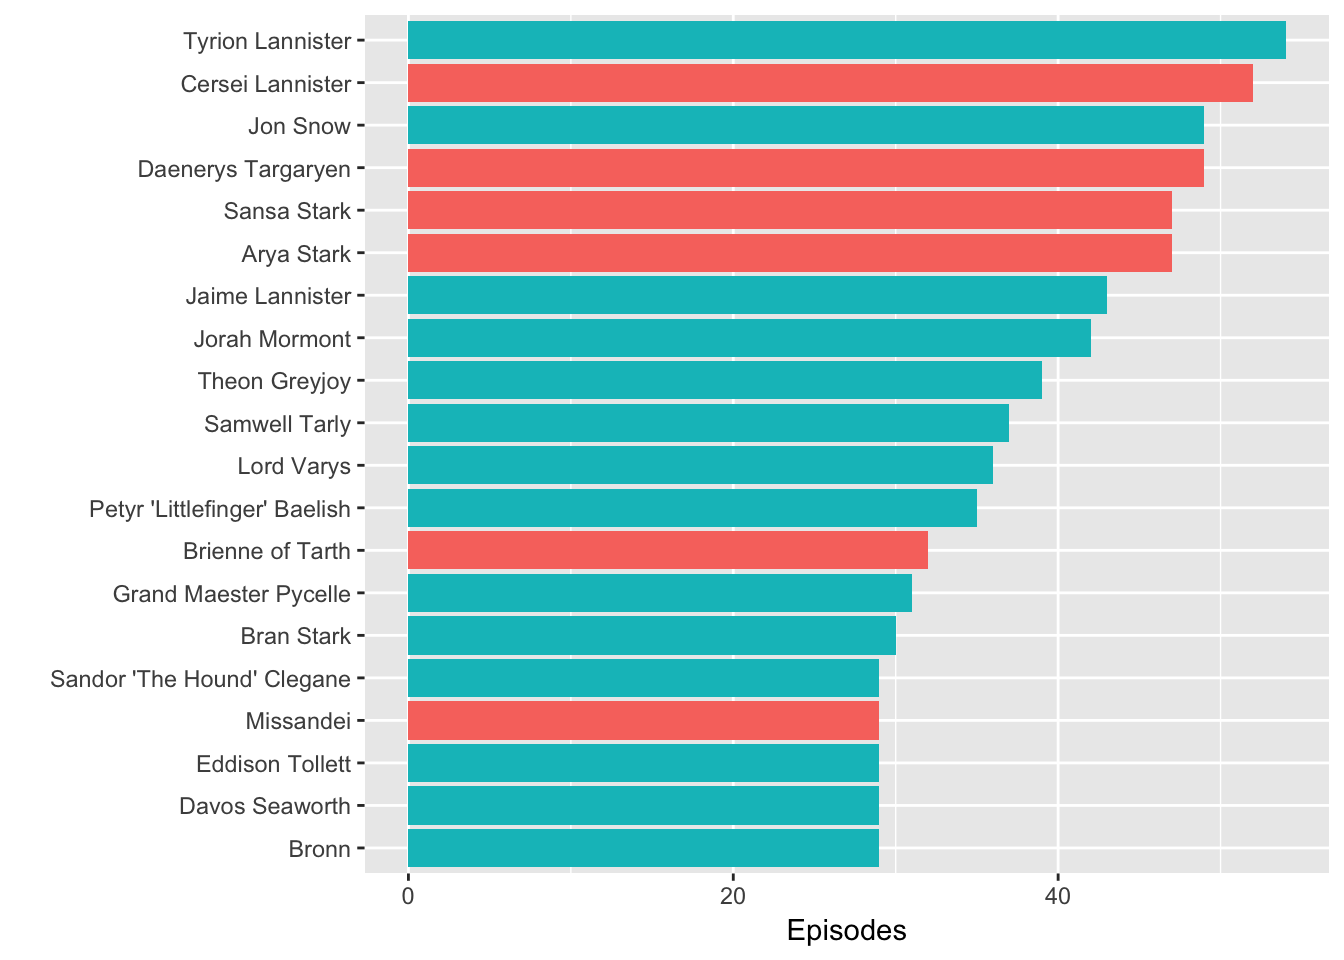
Tyrion has been present in the most episodes, followed by Cersei and Jon Snow. Now let’s group the data by gender and calculate the cumulative screentime for men and women.
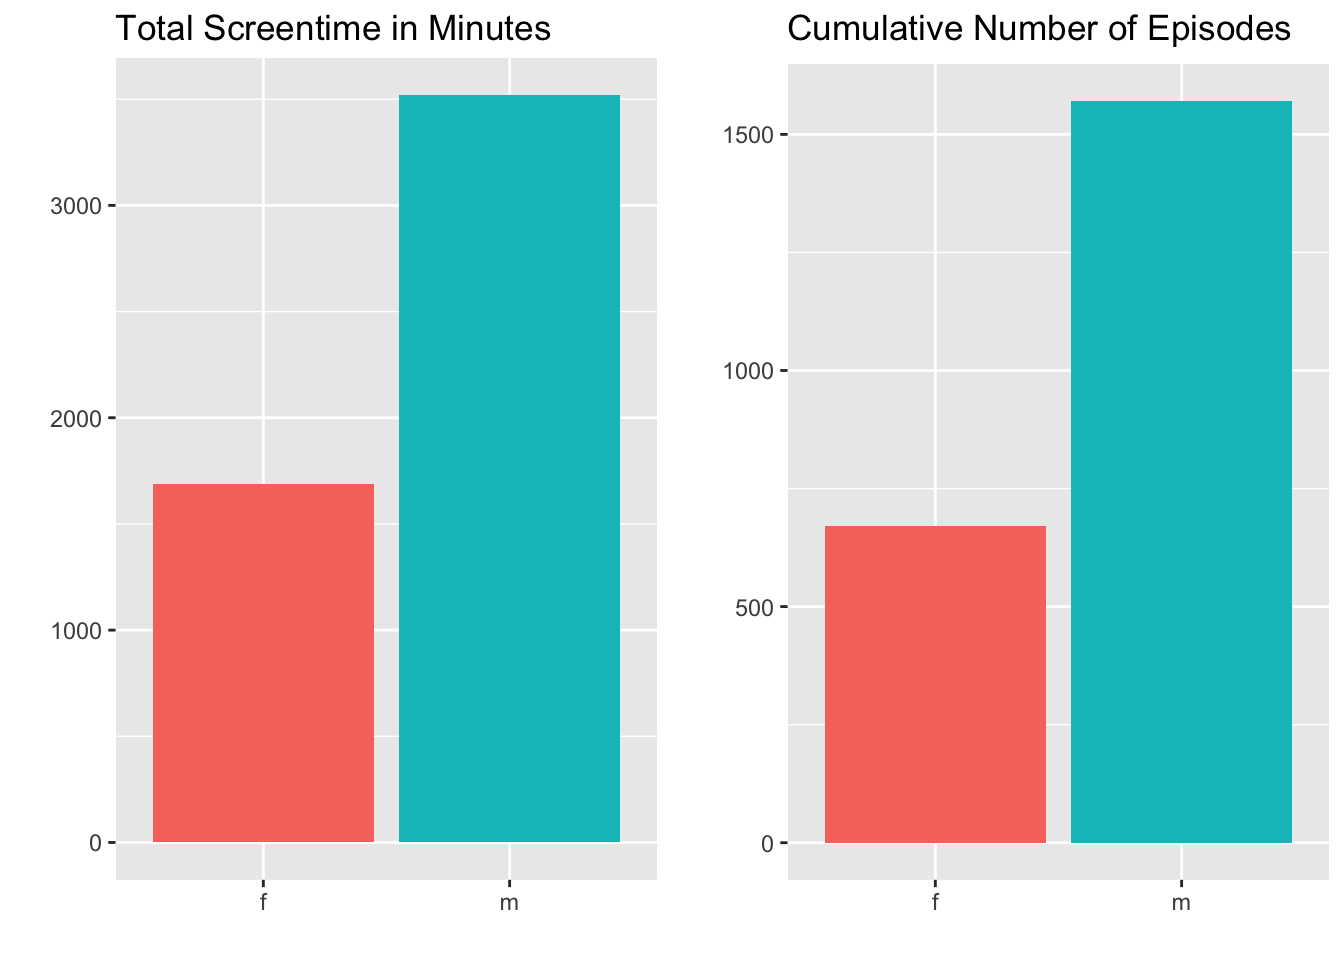
These plots seem to suggest that men dominate the show. We have to remember, however, that there are many more men in the show than women. Think of that what you will. It is still an interesting data problem.
It would be useful for us to look at the distribution of screentime for men and women in the show.
# Plot distribution of screentime
ggplot(screentimes) +
  geom_density(aes(x = screentime, color = gender)) +
  labs(x = "Screentime in Minutes", y = "Density", color = "Gender")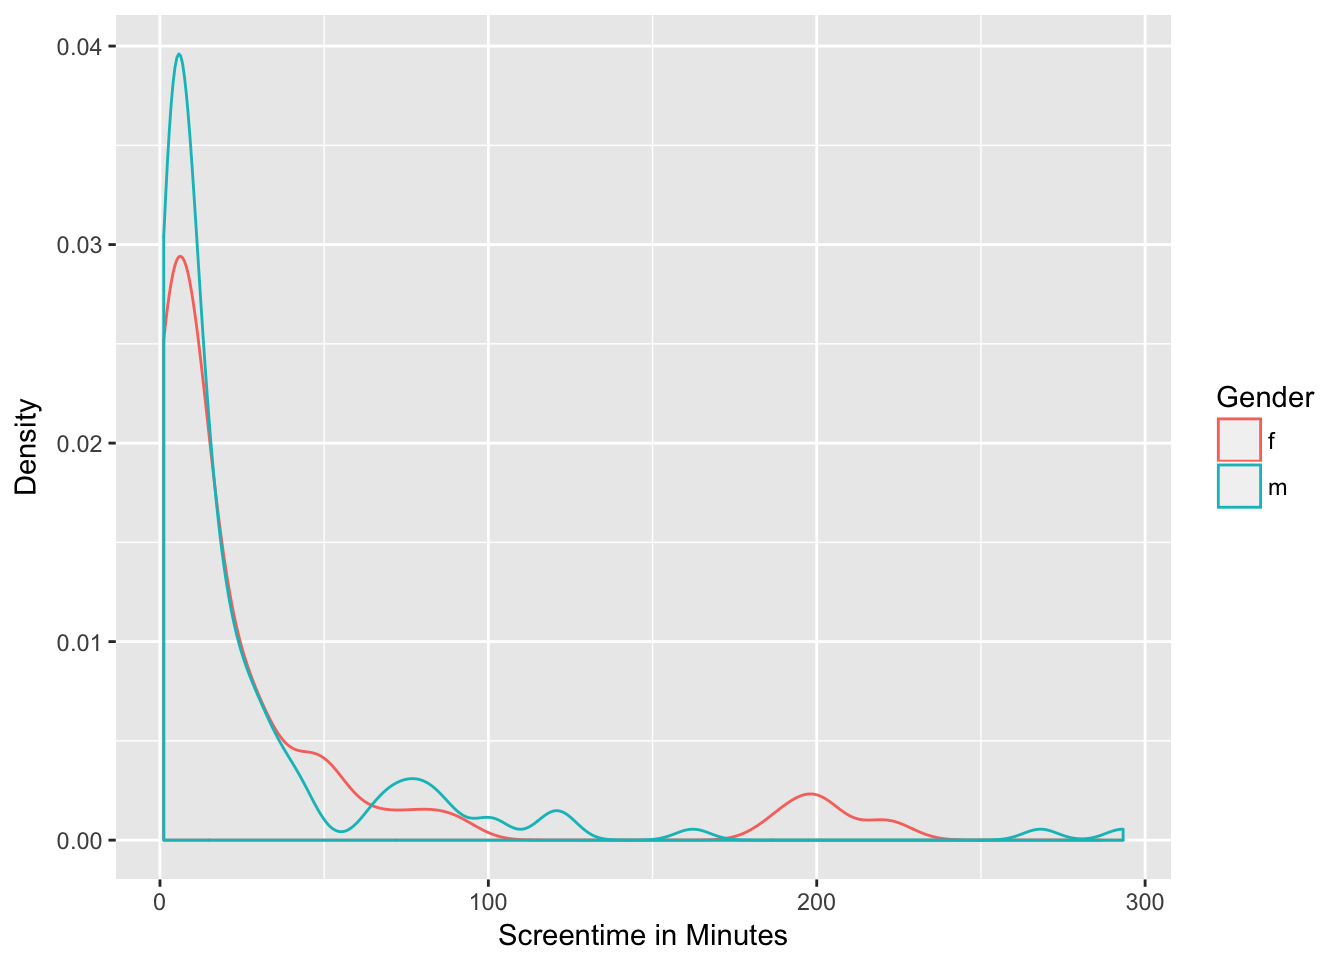
As we can see in the density plot above, the distribution is skewed to the left. There are many supporting characters with only a few minutes of screentime, and a few main characters that get most of the screentime. This is what we would expect.
Let’s also look at the CDFs of these distributions.
# Plot distribution of screentime
ggplot(screentimes) +
  stat_ecdf(aes(x = screentime, color = gender)) +
  scale_x_continuous(breaks = seq(0, 300, 60)) +
  labs(x = "Screentime in Minutes", y = "", title = "CDF of Screentime", color = "Gender")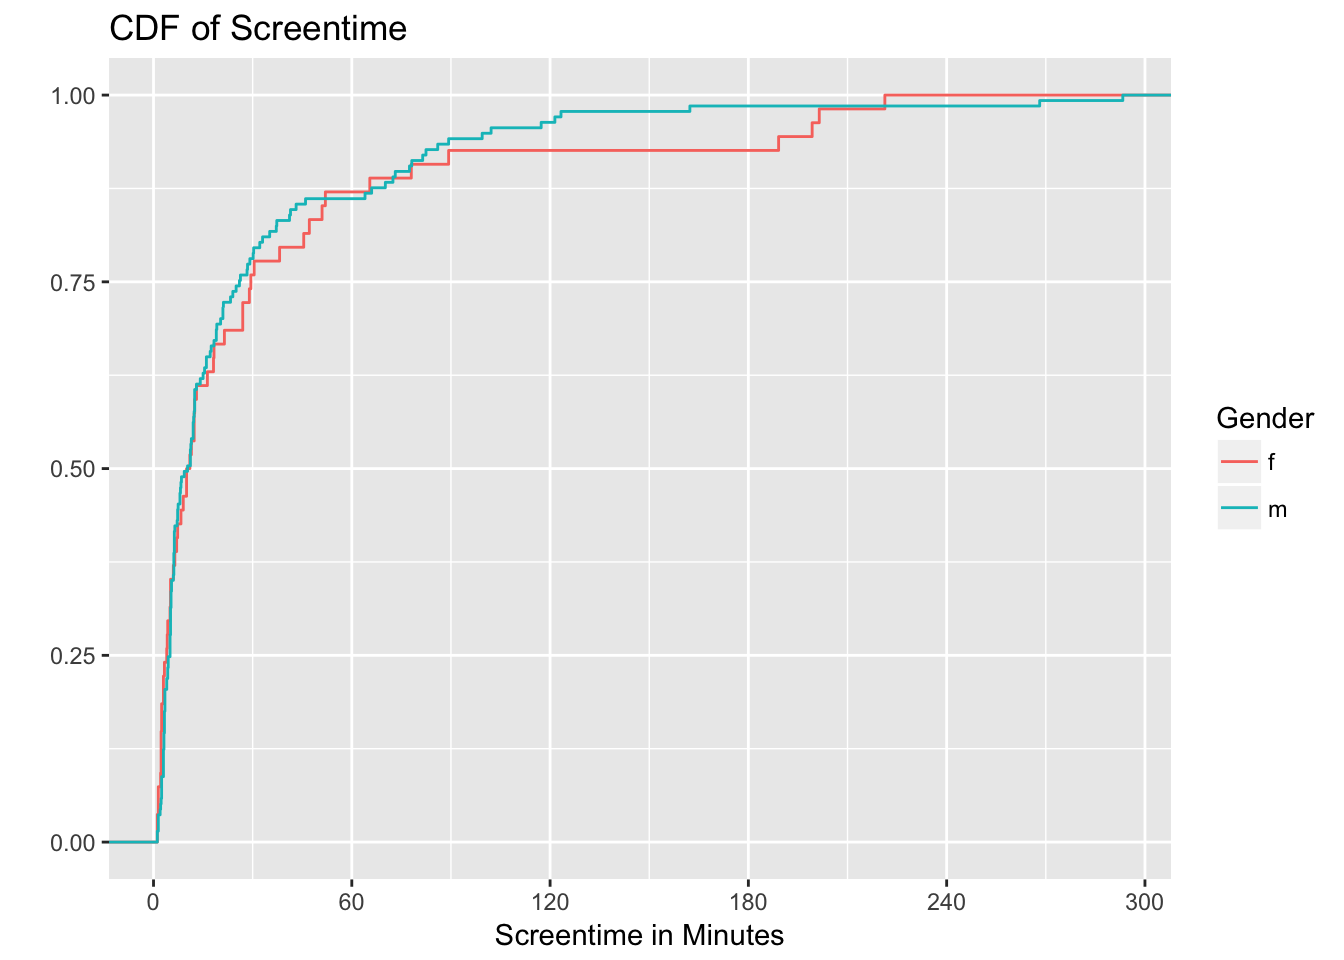
The distribution of screentime is quite similar for men and women. In fact, the percentage of women with 90-210 minutes of screentime is slightly higher than the percentage of men with that much screentime. This is also partially due to the fact that there is a longer list of men in the character list.
Screentime per episode
We all know Game of Thrones likes to kill characters off. We might therefore want to look at screentime per episode for each character. The Looker analysis did a good job of this. Let’s go ahead and create the screentime_per_episode variable.
screentimes <- screentimes %>%
  mutate(screentime_per_episode = screentime / episodes)
Now let’s plot the distribution of this new variable.
# Plot distribution of screentime
ggplot(screentimes) +
  geom_density(aes(x = screentime_per_episode, color = gender)) +
  labs(x = "Screentime Per Episode in Minutes", y = "Density", color = "Gender")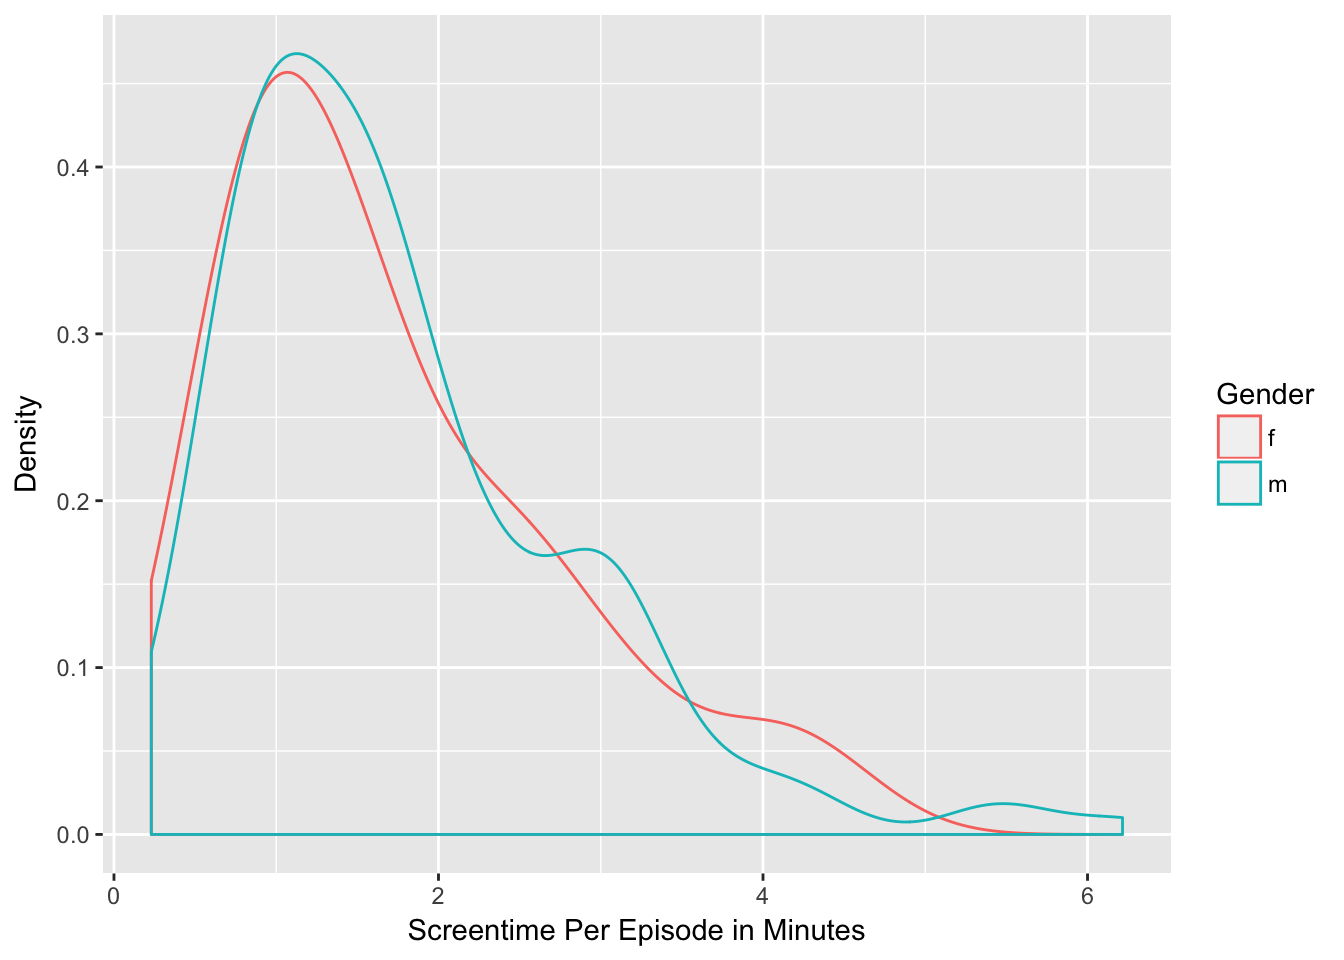
The distributions look slightly more gaussian in shape, but are still skewed to the right. The distribution for men is shifted slightly to the left, however the main female characters still make up for it. Let’s take a look at the CDFs.
# Plot distribution of screentime
ggplot(screentimes) +
  stat_ecdf(aes(x = screentime_per_episode, color = gender)) +
  labs(x = "Screentime in Minutes", y = "", title = "CDF of Screentime", color = "Gender")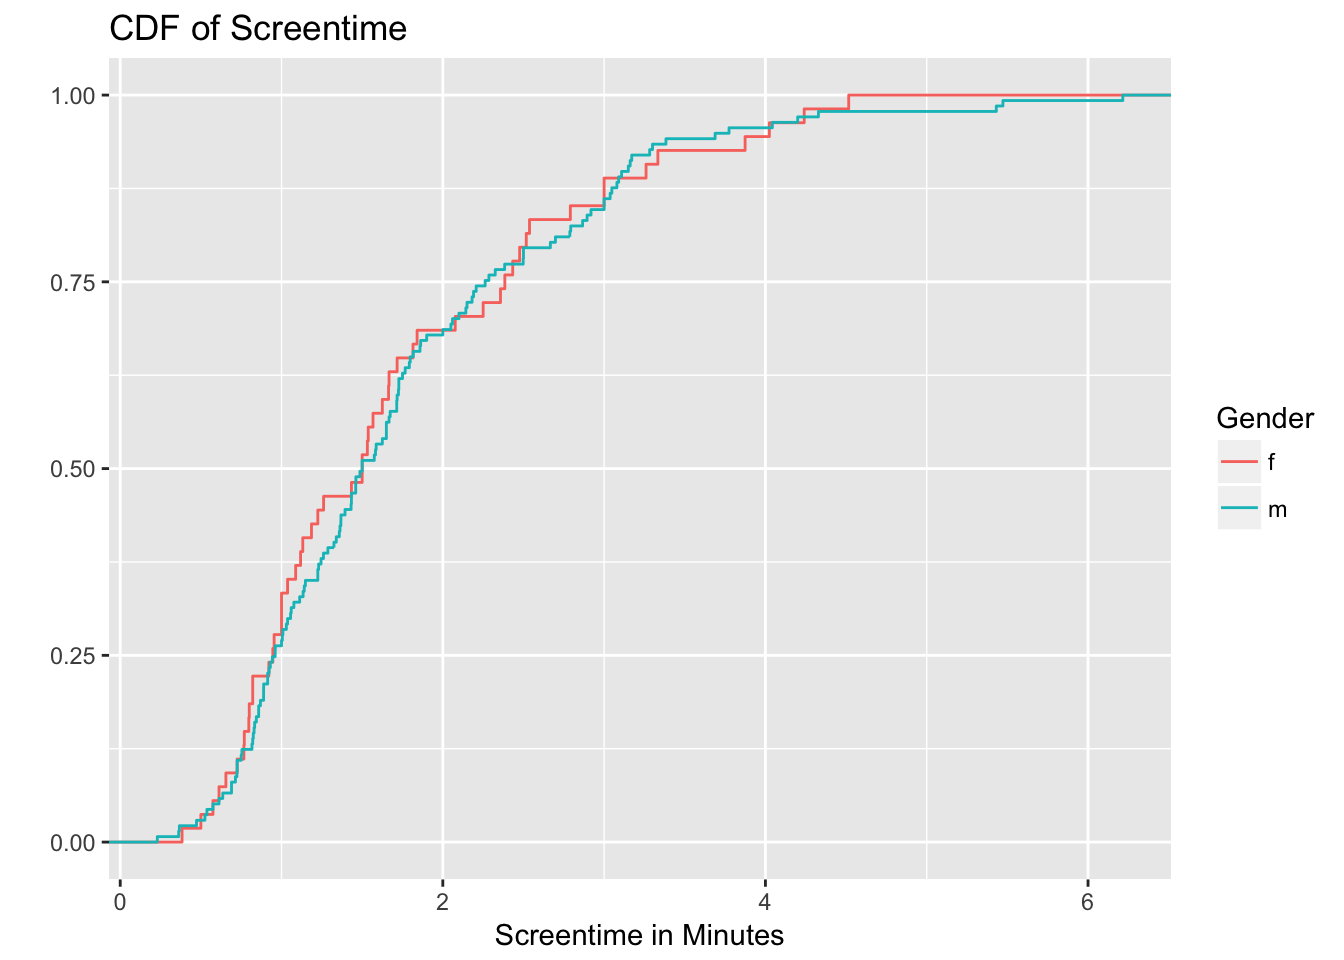
The distributions are quite similar, as we’ve just seen. Let’s look at average screentime per episode for both men and women.
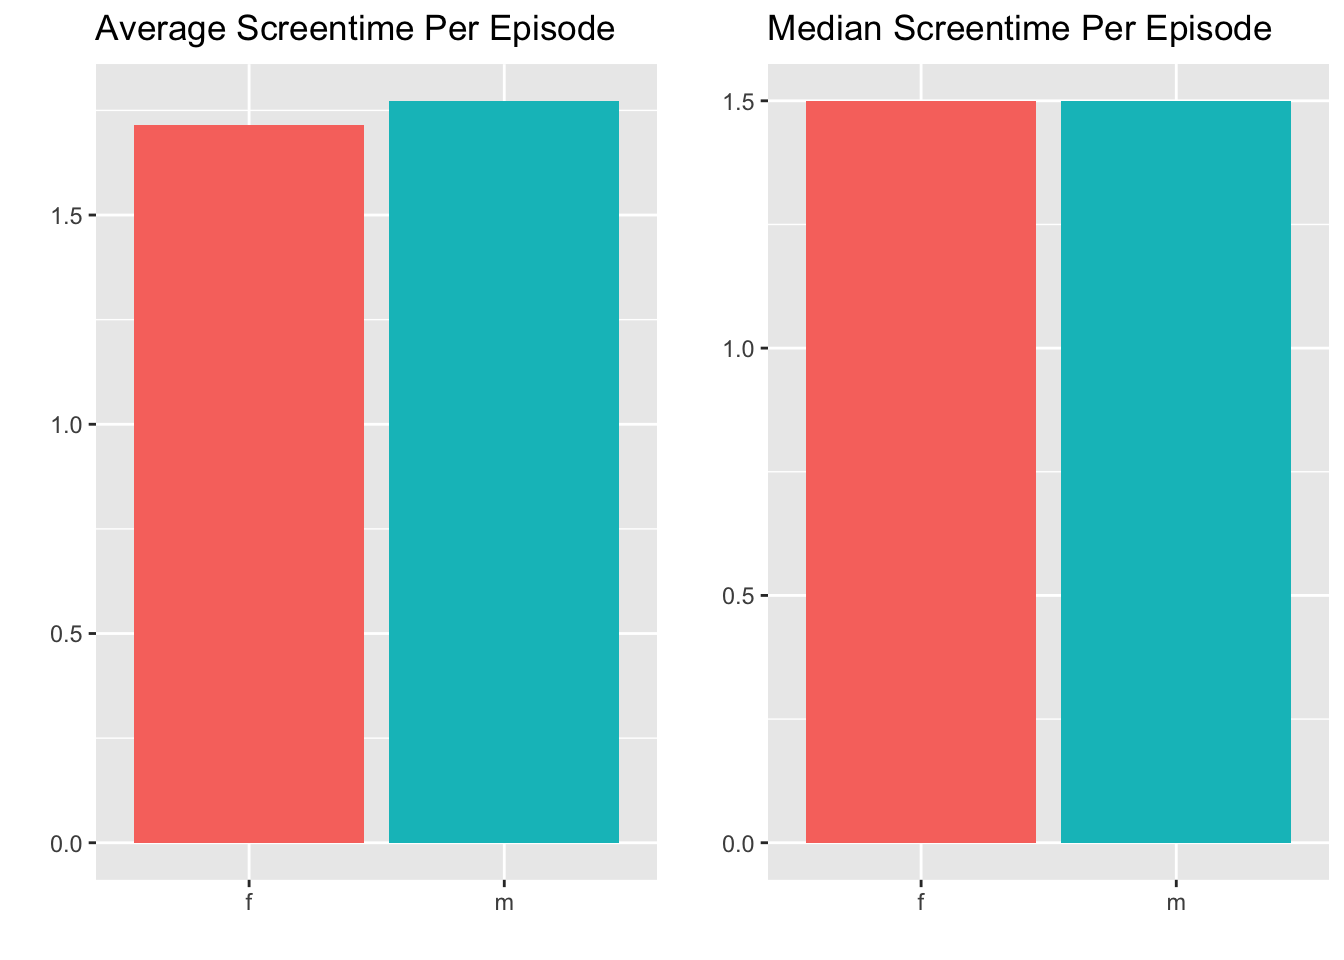
As we can see in these graphs, the average and median screentime per episode is quite similar for men and women in the show. Let’s sort our characters by screentime_per_episode.
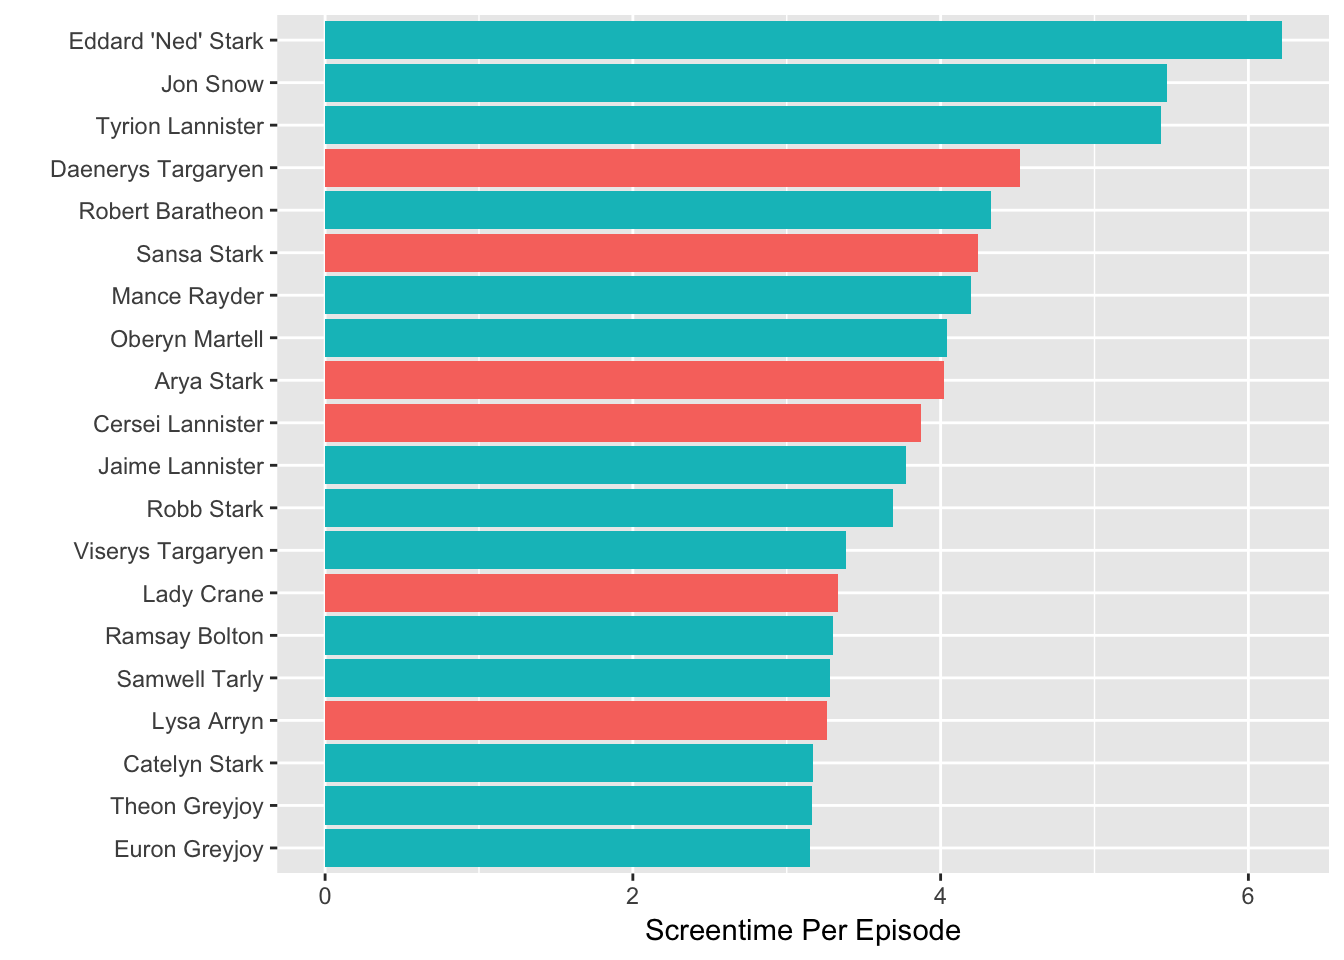
Wow. Hey Ned Stark! He doesn’t appear in many episodes, but he features heavily when he does. John Snow and Tyrion both tend to dominate episodes they appear in (when alive). It’s also interesting to see characters like Mancy Rayder and Oberyn Martell in this list above characters like Arya and Cersei.
Conclusions and next steps
Screentime is not quite distributed equally between men and women in Game of Thrones, which is due in part to the fact that there are so many more male characters in the show. The women that are featured do get a fair amount of screentime and are featured in as many episodes as the men.
In the future I’ll estimate the effect that gender has on screentime and episodes, and I’ll break down screntime by house (i.e. Lannister, Stark, Baratheon, Targaryen)!